. 2013 Jan;9(1):e1003098.
doi: 10.1371/journal.ppat.1003098. Epub 2013 Jan 10.

Teleost fish mount complex clonal IgM and IgT responses in spleen upon systemic viral infection

Affiliations

Teleost fish mount complex clonal IgM and IgT responses in spleen upon systemic viral infection

Rosario Castro et al. PLoS Pathog. 2013 Jan.

Abstract

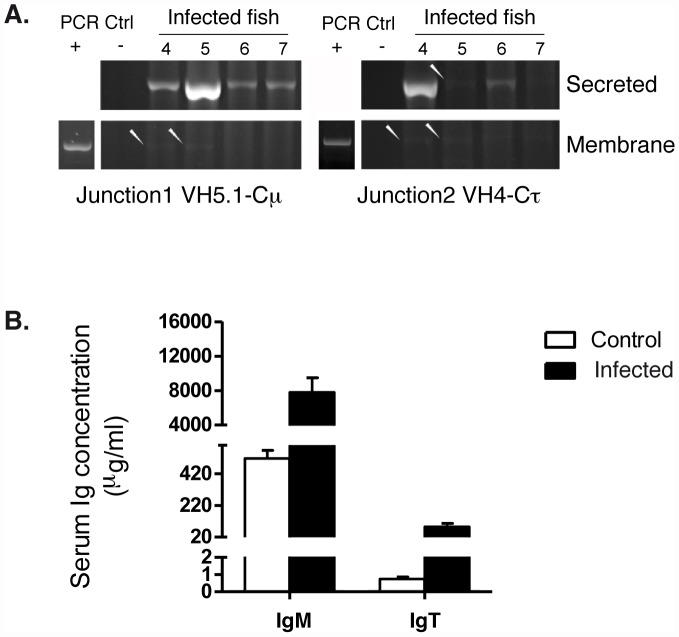
Upon infection, B-lymphocytes expressing antibodies specific for the intruding pathogen develop clonal responses triggered by pathogen recognition via the B-cell receptor. The constant region of antibodies produced by such responding clones dictates their functional properties. In teleost fish, the clonal structure of B-cell responses and the respective contribution of the three isotypes IgM, IgD and IgT remain unknown. The expression of IgM and IgT are mutually exclusive, leading to the existence of two B-cell subsets expressing either both IgM and IgD or only IgT. Here, we undertook a comprehensive analysis of the variable heavy chain (VH) domain repertoires of the IgM, IgD and IgT in spleen of homozygous isogenic rainbow trout (Onchorhynchus mykiss) before, and after challenge with a rhabdovirus, the Viral Hemorrhagic Septicemia Virus (VHSV), using CDR3-length spectratyping and pyrosequencing of immunoglobulin (Ig) transcripts. In healthy fish, we observed distinct repertoires for IgM, IgD and IgT, respectively, with a few amplified μ and τ junctions, suggesting the presence of IgM- and IgT-secreting cells in the spleen. In infected animals, we detected complex and highly diverse IgM responses involving all VH subgroups, and dominated by a few large public and private clones. A lower number of robust clonal responses involving only a few VH were detected for the mucosal IgT, indicating that both IgM(+) and IgT(+) spleen B cells responded to systemic infection but at different degrees. In contrast, the IgD response to the infection was faint. Although fish IgD and IgT present different structural features and evolutionary origin compared to mammalian IgD and IgA, respectively, their implication in the B-cell response evokes these mouse and human counterparts. Thus, it appears that the general properties of antibody responses were already in place in common ancestors of fish and mammals, and were globally conserved during evolution with possible functional convergences.


Conflict of interest statement

The authors have declared that no competing interests exist.

Figures

Figure 1
Figure 1. Spectratyping analysis of the spleen B cell response to VHSV.
(A) Schematic representation of rainbow trout immunoglobulin heavy (IGH) locus, Immunoscope primers and typical IGH μ, δ and τ transcripts. * denotes the fluorescent primers used in run-offs. (B) CDR3 length distribution profiles of μ, δ and τ transcripts for selected VHC combinations in the spleen of naïve and infected animals. Y-axis: fluorescence arbitrary units, x-axis: length of run-off products; for the sake of clarity, Max and Min values for each spectratyping profile are given in Figure S1C. (C–E) Perturbation scores calculated to reference profile representing the average of the VHCμ, VHCδ or VHCτ distributions, for the IgM, IgD or IgT, in control or infected animals. Scores are represented on grey to red-scale, red color indicating a strong difference of a given profile to the reference.
Figure 2
Figure 2. 454 pyrosequencing-based analysis of the spleen IgM response to VHSV.
A. Normalized distributions of JST observed n times in the sequence datasets from control and virus infected fish are represented for VH5.1 and VH4. Large clonal expansions are indicated by high number of occurrences of expressed junction types in infected animals. (Total number of sequences on which each distribution is based: VH5.1Cμ control: 4306; VH5.1Cμ infected: 6245; VH4Cμ control: 4107; VH4Cμ infected: 7755). B. J usage among VH5.1Cμ transcripts in control and VHSV infected fish.
Figure 3
Figure 3. Representation of clonal complexity of spleen VH5.1-Cμ and VH4-Cμ responses.
A. The program Pajek distributes different JST on the surface of a sphere. Large clones are represented by red beads with a diameter proportional to the number of junctions present in the sequence dataset, and connections link junctions that differ at only one position. Each vertex in the network refers to a different CDR3 amino acid sequence, and the size of the vertex represents the number of identical sequences. Two vertexes are therefore connected if the CDR3 amino acid sequences they represent differ at one and only one position at the AA level. VH5.1Cμ JST distribution is represented. The total number of sequence reads on which each graph is based is indicated. No global re-normalization was performed. B. 3D-Representation of VH5.1-Cμ and VH4-Cμ clonal expansions found in control and infected fish. The three axes enumerate observed V amplification primer (x), J (y), and CDR3 sequences (z) values, allowing comparison between fish. The size of the sphere at each point corresponds to the number of reads matching a particular JST. JST for which H0 was not rejected are represented in fish–specific colors; other repeated JST are also shown as white spheres to illustrate the structure of the dataset. Large clonal expansions of identical junctions found in different individuals are linked in red and the IMGT-CDR3 AA sequences indicated inside a plain ellipse. These graphs represents clonal expansions revealed by sequence types present more than 15 times among datasets of the following sizes (reads with productive junctions: VH5.1Cμ control = 1446, 1288, 1572; VH5.1Cμ infected = 1442, 1403, 1863, 1537; VH4Cμ control = 1428,1441,1238; VH4Cμ infected = 2213, 1212, 2603, 1727). No global re-normalization was performed between datasets.
Figure 4
Figure 4. 454 pyrosequencing-based analysis of the spleen IgT response to VHSV.
A. Normalized distributions of JST observed n times in the sequence datasets from control and virus infected fish are represented for VH5.1 and VH4. Large clonal expansions are indicated by high number of occurrences of expressed junction types in infected animals. (Total number of sequences on which each distribution is based: VH5.1-Cτ control: 2181; VH5.1-Cτ infected: 4444; VH4-Cτ control: 1437; VH4-Cτ infected: 7528). B. J usage among VH4-Cτ transcripts in control and VHSV infected fish. C. Relative mRNA expression of VH4 rearranged to J1 and J2 in the spleen of infected fish compared to control fish. Results were normalized to EF-1α and relative expression was calculated using the Pfaffl method. Each value is the fold increase, expressed as the average of the results of comparison of one infected fish with the results of 3 control fish. Control values are set at 1.* indicates a significant increase with respect to controls (p<0.05).
Figure 5
Figure 5. Representation of clonal complexity of spleen VH5.1-Cτ and VH4-Cτ responses.
A. Pajek representation of VH4-Cτ JST diversity and distribution in control and infected fish. total number of sequence reads on which each graph is based is indicated. B. 3D-representation of VH5.1-Cτ and VH4-Cτ clonal expansions found in control and infected. Clonal expansions of identical junctions found in different individuals are linked in red and the IMGT-CDR3 AA sequences indicated inside a plain ellipse. JST for which H0 was not rejected are represented in fish–specific colors; other repeated JST are also shown as white spheres to illustrate the structure of the dataset. These graphs represents clonal expansions revealed by sequence types present more than 15 times among datasets of the following sizes (reads with productive junctions: VH4Cτ control = 198, 212, 1027; VH4Cτ infected = 1349, 2163, 1964, 2052; VH5.1Cτ control = 1202, 791, 188; VH5.1Cτ infected = 1344, 983, 1044, 1073). No global re-normalization was performed between datasets.
Figure 6
Figure 6. Increased expression of secreted IgM and IgT following virus infection.
A. Typical results produced by specific amplification of secreted and membrane-bound transcripts containing selected JST from infected individuals (a–d). JST corresponding to the IgM public response (junction 1, VH5.1Cμ: ARYNNNAFDY) and JST corresponding to a well-expanded IgT V4Cτ response (junction 2, VH4-Cτ: ARDGLYTGRSYAAFDS) are shown. Non-expanded JST could never be specifically amplified. PCR positive controls (PCR Ctrl +) were amplified from the specific products cloned and sequenced. PCR negative controls (Ctrl −) represent reactions without cDNA template. B. Serum IgM and IgT concentration in control and infected fish.

Similar articles

Cited by

References

    1. Jerne NK (1955) The natural selection theory of antibody formation. Proc Natl Acad Sci USA 41: 849–857. - PMC - PubMed
    1. Burnet FM (1957) A modification of Jerne's theory of antibody production using the concept of clonal selection. Aust J Sci 20: 67–70. - PubMed
    1. Flajnik MF, Kasahara M (2011) Origin and evolution of the adaptive immune system: genetic events and selective pressures. Nat Rev Genet 11: 47–59. - PMC - PubMed
    1. Flajnik MF, Du Pasquier L (2008) Evolution of the immune system. In: Paul W, editor. Fundamental Immunology. 6th edition. Philadelphia: Lippincott and Wolters Kluwer. pp. 56–125.
    1. Zwollo P, Cole S, Bromage E, Kaattari S (2005) B cell heterogeneity in the teleost kidney: evidence for a maturation gradient from anterior to posterior kidney. J Immunol 174: 6608–6616. - PubMed

Publication types

MeSH terms