. 2013;9(1):e1003137.
doi: 10.1371/journal.pgen.1003137. Epub 2013 Jan 10.

Aberration in DNA methylation in B-cell lymphomas has a complex origin and increases with disease severity

Affiliations

Aberration in DNA methylation in B-cell lymphomas has a complex origin and increases with disease severity

Subhajyoti De et al. PLoS Genet. 2013.

Abstract

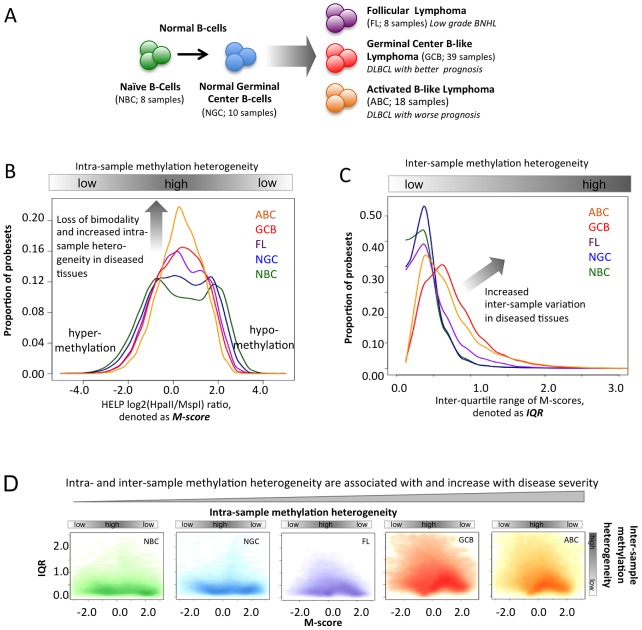
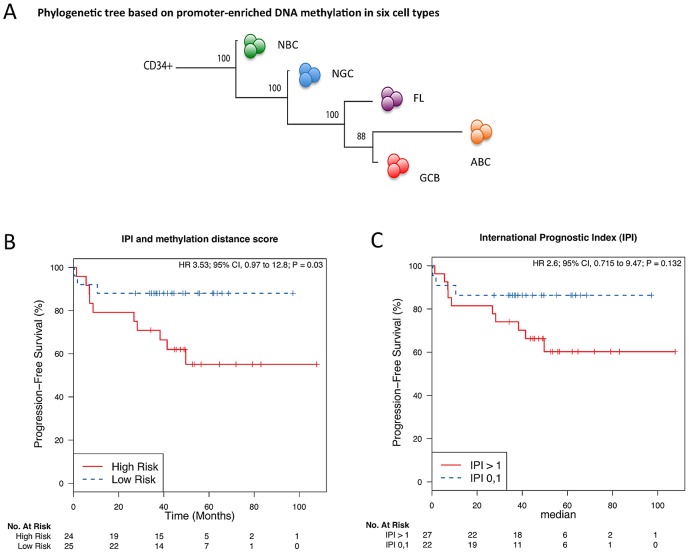
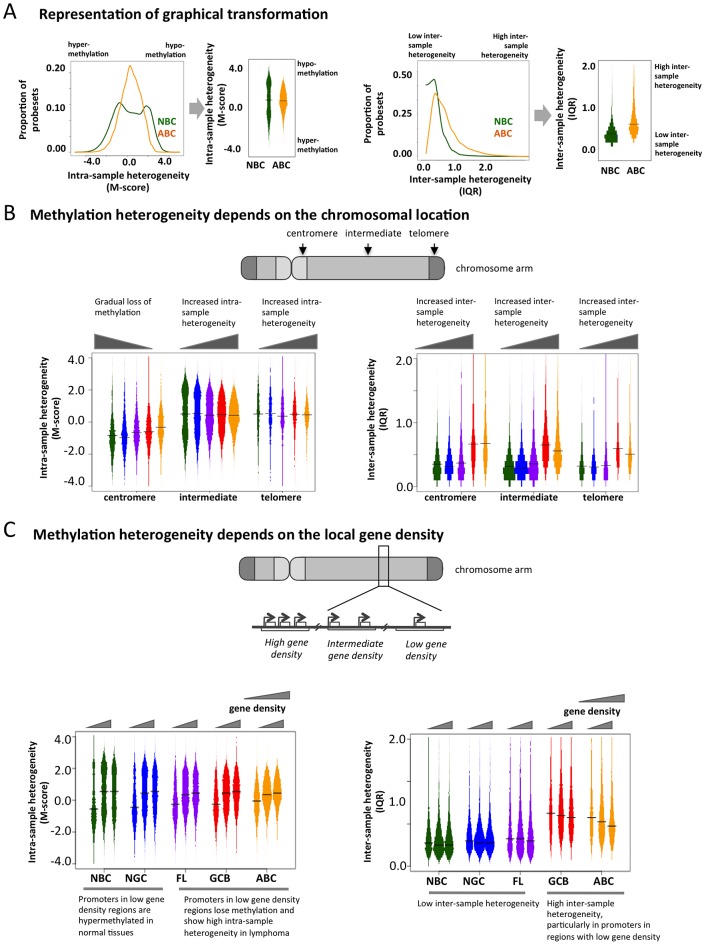
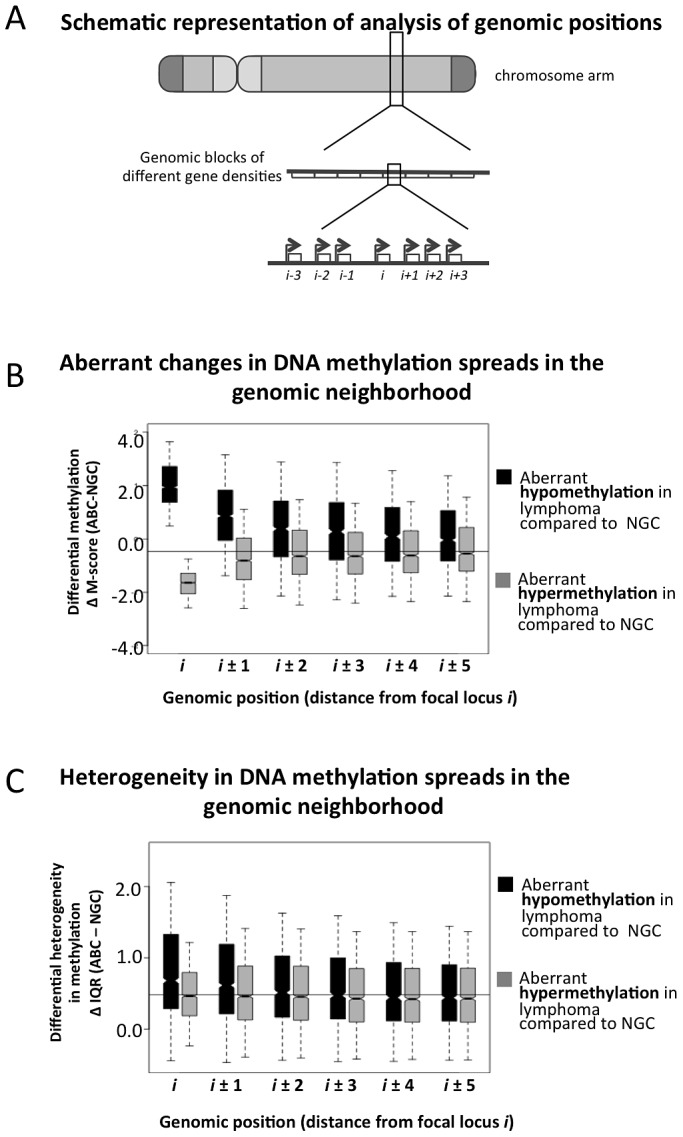
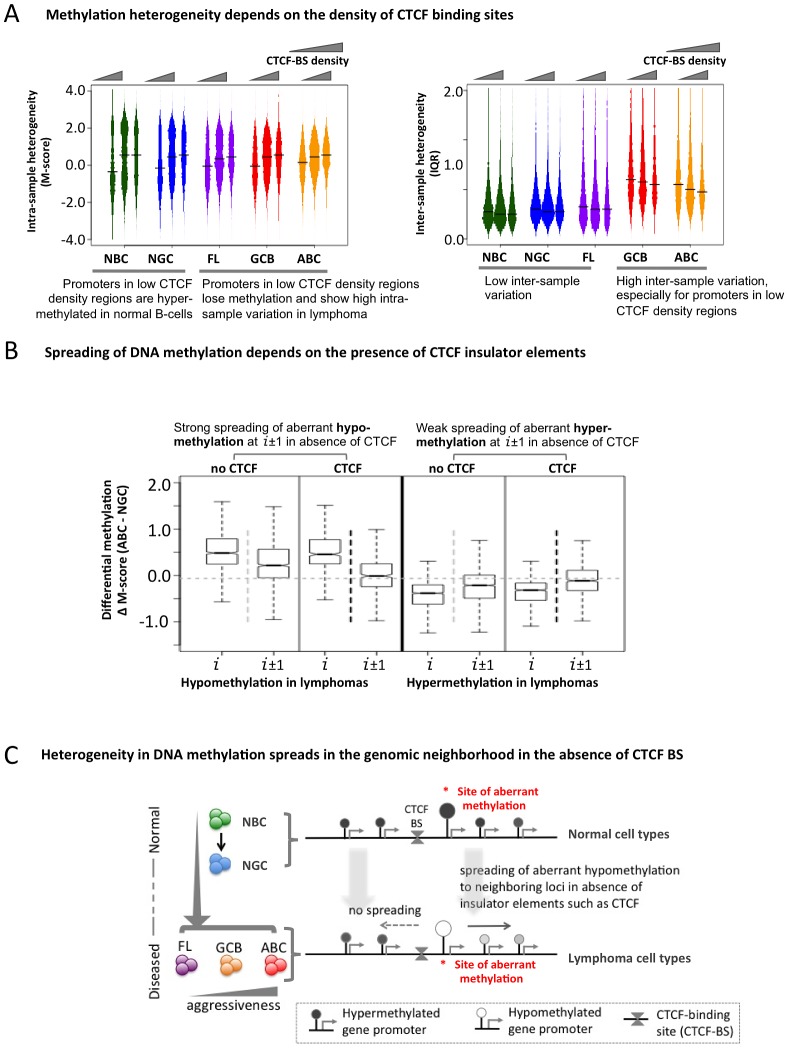
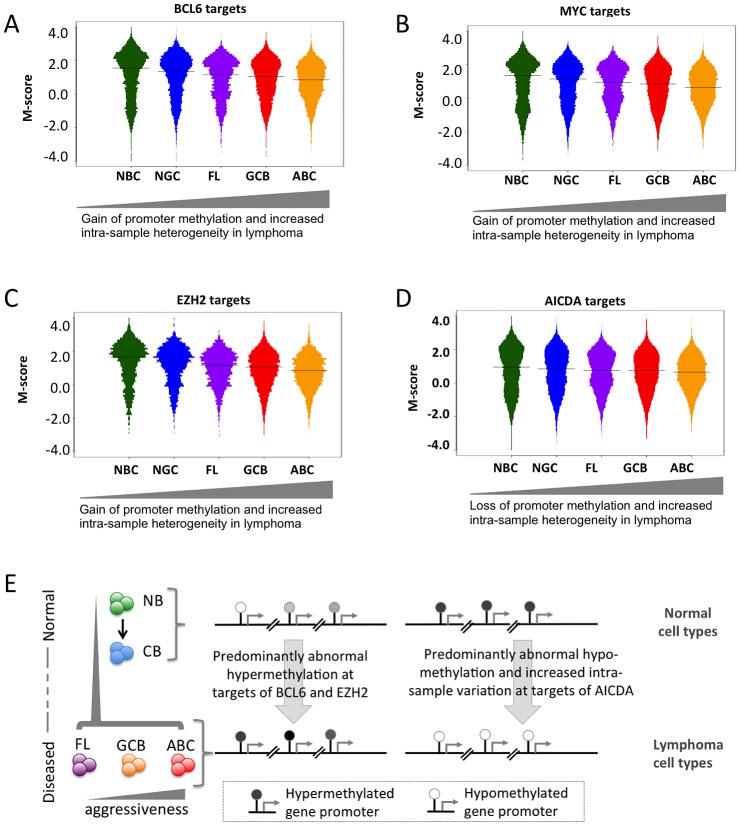
Despite mounting evidence that epigenetic abnormalities play a key role in cancer biology, their contributions to the malignant phenotype remain poorly understood. Here we studied genome-wide DNA methylation in normal B-cell populations and subtypes of B-cell non-Hodgkin lymphoma: follicular lymphoma and diffuse large B-cell lymphomas. These lymphomas display striking and progressive intra-tumor heterogeneity and also inter-patient heterogeneity in their cytosine methylation patterns. Epigenetic heterogeneity is initiated in normal germinal center B-cells, increases markedly with disease aggressiveness, and is associated with unfavorable clinical outcome. Moreover, patterns of abnormal methylation vary depending upon chromosomal regions, gene density and the status of neighboring genes. DNA methylation abnormalities arise via two distinct processes: i) lymphomagenic transcriptional regulators perturb promoter DNA methylation in a target gene-specific manner, and ii) aberrant epigenetic states tend to spread to neighboring promoters in the absence of CTCF insulator binding sites.


Conflict of interest statement

The authors have declared that no competing interests exist.

Figures

Figure 1
Figure 1. Methylation variation in normal and lymphoma samples.
(A) Summary of the normal and lymphoma samples used in this study. (B) Histogram representation of DNA methylation score (M-score, horizontal axis) and frequency (vertical axis). Positive M-scores represent hypo-methylation while negative scores represent hyper-methylation. The DNA methylation distributions of samples are shown using the same color code as in panel A. The methylation patterns of NBC are bimodal, where the positive node represents hypo-methylation and the negative node represents hyper-methylation. The proportion of promoters with intermediate M-score (around zero), which represents high intra-sample variation, increases for lymphoma categories with increased disease severity. (C) The histogram represents the frequency distribution of inter-quartile ranges (IQR) of the M-scores per probeset for normal and diseased samples. The vertical axis represents the frequency of probesets and the horizontal axis represents the IQR. High IQR values indicate high inter-sample variation, and the proportion of such promoters increases for lymphoma categories with increased disease severity. (D) The scatter plot reflects the joint distribution of M-scores and IQR, which represent intra- and inter-sample variation, respectively, per probeset for normal B-cells and lymphoma categories. The color intensity is proportional to the density of points on the graph. High inter-sample variation is also associated with high intra-sample variation. The distribution of points becomes progressively broader and more smear-like in lymphoma samples vs. normal B-cells. The colors are the same as in (A).
Figure 2
Figure 2. The extent of DNA methylation aberration is predictive of patient survival.
(A) Phylogenetic tree, as estimated based on the correlation of group-averaged M-scores. Departure from normal methylation patterns is correlated with disease severity of the lymphoma samples. (B–C) Kaplan-Meier curves for risk groups defined according to their methylation distance score (i.e. distance from normal B-cells), which reflects how different a sample's methylation profile is from that of NBC or NGC, for all DLBCL (GCB and ABC) samples. (B) Multivariate analysis with the International Prognostic Index (IPI) and distance to NBC. (C) Only IPI.
Figure 3
Figure 3. Genome-wide patterns of aberrant methylation.
(A) Graphical explanation of how the distribution of M-scores and IQR are transformed into violin distribution plots to enable more efficient visualization and comparison on intra- and inter-sample variability. (B) Distribution of the methylation score (M-score, left) and inter-quartile ranges (IQR, right) at probesets in centromeric, telomeric, and intermediate regions for normal and diseased tissues. Bar width is proportional to the number of data points, and the colors are the same as in Figure 1A. (C) Distributions of M-score (left) and IQR (right) are shown for gene-poor, gene-rich, and intermediate regions.
Figure 4
Figure 4. Spreading of aberrant methylation to neighboring probesets in the ABC samples.
(A) A schematic representation of how the genome was divided into blocks of genes to study spreading of altered DNA methylation. (B–C) Analysis of spreading of aberrant methylation within genomic neighborhoods. Loci “i” represent probesets that are significantly hypo- (black) or hyper-methylated (grey) in lymphoma samples compared to normal tissues, and loci “i±j” represent both the (i+j)-th and (ij)-th neighbors of those probesets. For instance, when we focused on probeset #10 (i.e. i = 10), we analyzed spreading of aberrant methylation at probesets #5, 6, 7, 8, 9, 11, 12, 13, 14 and 15. Panel B displays the change in methylation states while panel C shows the change in IQR (variability between samples).
Figure 5
Figure 5. The insulator factor CTCF prevents spreading of aberrant methylation.
(A) Methylation heterogeneity depends on the density of CTCF-binding sites. Methylation state (M-score, left) and inter-sample methylation variation (IQR, right) are shown for CTCF-BS-poor, CTCF-BS-rich, and intermediate regions. (B) Spreading of aberrant methylation from genomic position “i” to “i±1” (i.e. two neighboring sites) when at least one CTCF-BS is present (black vertical dotted line) and when no CTCF-BS is present (light grey vertical dotted line) between “i” and “i±1”, for aberrant hypo-methylation (two left panels) and aberrant hyper-methylation (two right panels). The presence of CTCF-BS more efficiently restricts the spreading of aberrant hypo-methylation. (C) A schematic overview showing spreading of abnormal methylation in the absence of CTCF-binding sites in genomic neighborhood.
Figure 6
Figure 6. Genomic localization of transcriptional regulators and AICDA associates with sites of aberrant DNA methylation.
(A–D) Methylation heterogeneity of promoters of genes that are targets of master regulators. The panels display the distribution of methylation scores (M-scores) for promoters of target genes of (A) BCL6, (B) MYC, (C) EZH2, and (D) AICDA. (E) A schematic overview showing targeted abnormal promoter methylation by master regulators such as MYC, BCL6, EZH2 and AICDA in the lymphoma subtypes.
Figure 7
Figure 7. Genes associated with aberrant DNA methylation patterns B-cell lymphoma.
(A) List of genes potentially associated with aberrant methylation patterns in DLBCL. Boxplots visualize the distribution of Pearson correlation coefficients of primary variable (expression level of a candidate gene) and the fitted variables (ΔM of promoters). The numbers on top represent the summarized quantity R2, i.e. statistical variance in the fitted variable explained by the primary variable (in percent). See Text S1, Module 7 for more details. Statistically significant R2 values (p<0.05) are marked with an asterisk. (B) List of the top 10 genes with highest R2 the unbiased genome-wide analysis. See Text S1, Module 7 for more details.

Similar articles

Cited by

References

    1. TNHLCP (1997) A clinical evaluation of the International Lymphoma Study Group classification of non-Hodgkin's lymphoma. The Non-Hodgkin's Lymphoma Classification Project. Blood 89: 3909–3918. - PubMed
    1. Tan D, Horning SJ (2008) Follicular lymphoma: clinical features and treatment. Hematol Oncol Clin North Am 22: 863–882, viii. - PubMed
    1. Rosenwald A, Wright G, Chan WC, Connors JM, Campo E, et al. (2002) The use of molecular profiling to predict survival after chemotherapy for diffuse large-B-cell lymphoma. N Engl J Med 346: 1937–1947. - PubMed
    1. Klein U, Dalla-Favera R (2008) Germinal centres: role in B-cell physiology and malignancy. Nat Rev Immunol 8: 22–33. - PubMed
    1. Shaknovich R, Cerchietti L, Tsikitas L, Kormaksson M, De S, et al. (2011) DNA methyltransferase 1 and DNA methylation patterning contribute to germinal center B-cell differentiation. Blood 118: 3559–3569. - PMC - PubMed

Publication types

MeSH terms

Associated data