. 2013;9(1):e1003167.
doi: 10.1371/journal.pgen.1003167. Epub 2013 Jan 10.

Mutational spectrum drives the rise of mutator bacteria

Affiliations

Mutational spectrum drives the rise of mutator bacteria

Alejandro Couce et al. PLoS Genet. 2013.

Abstract

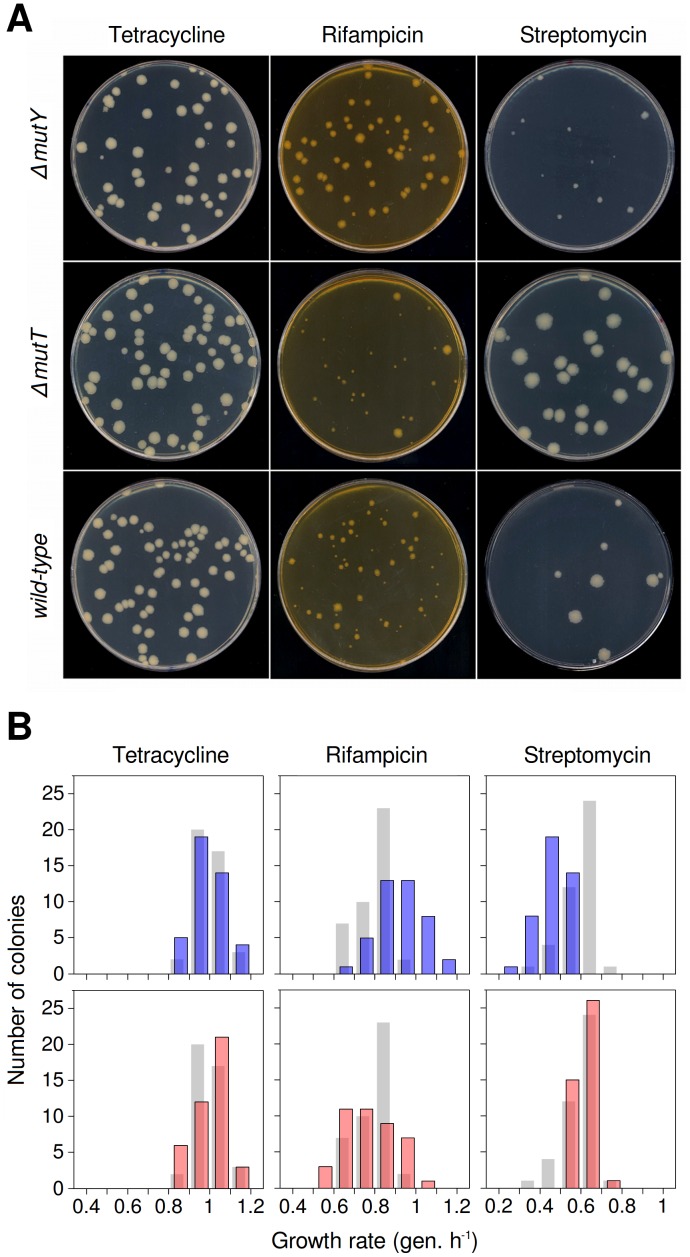
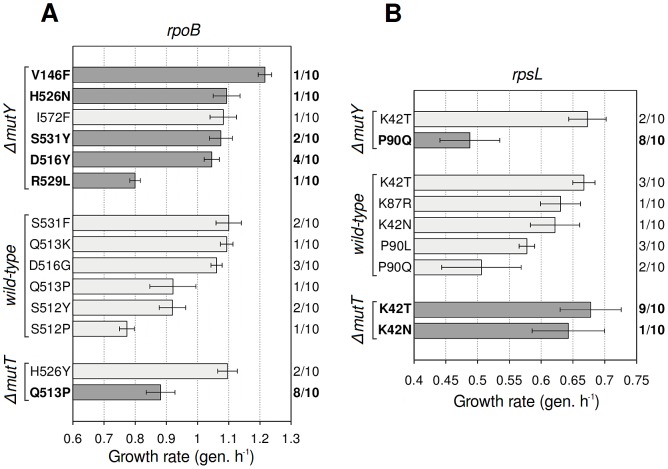
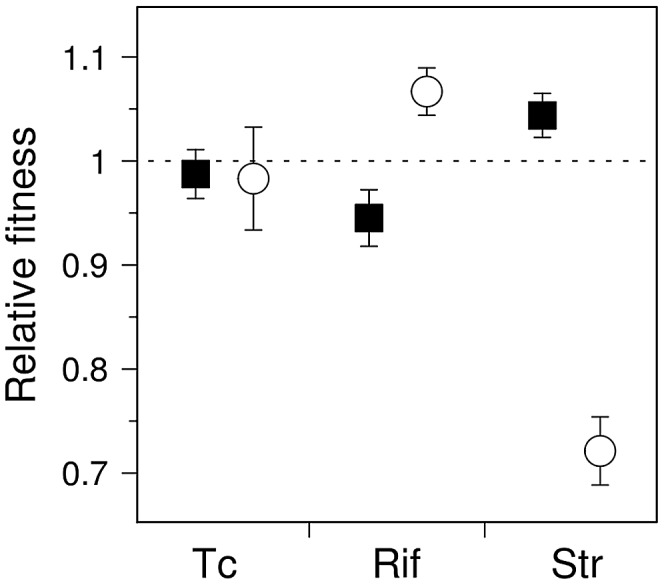
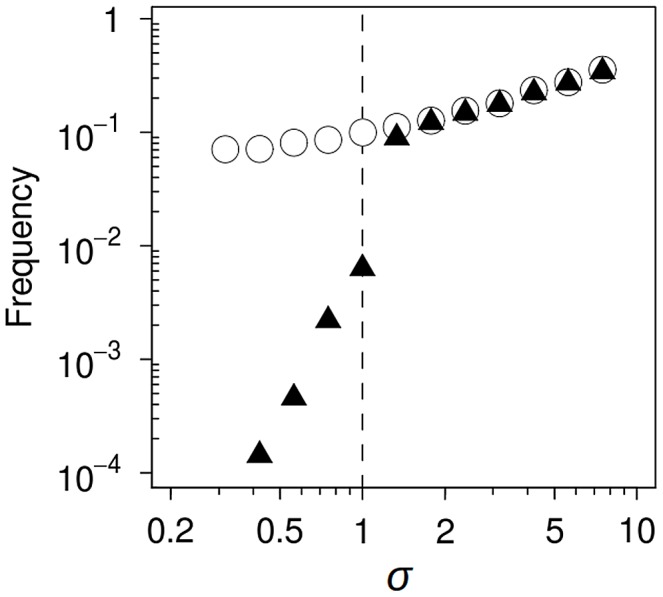
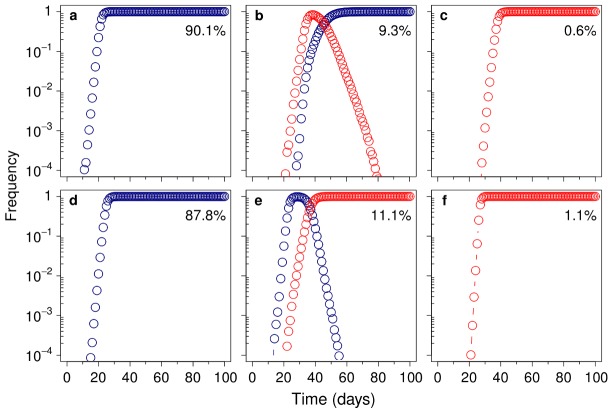
Understanding how mutator strains emerge in bacterial populations is relevant both to evolutionary theory and to reduce the threat they pose in clinical settings. The rise of mutator alleles is understood as a result of their hitchhiking with linked beneficial mutations, although the factors that govern this process remain unclear. A prominent but underappreciated fact is that each mutator allele increases only a specific spectrum of mutational changes. This spectrum has been speculated to alter the distribution of fitness effects of beneficial mutations, potentially affecting hitchhiking. To study this possibility, we analyzed the fitness distribution of beneficial mutations generated from different mutator and wild-type Escherichia coli strains. Using antibiotic resistance as a model system, we show that mutational spectra can alter these distributions substantially, ultimately determining the competitive ability of each strain across environments. Computer simulation showed that the effect of mutational spectrum on hitchhiking dynamics follows a non-linear function, implying that even slight spectrum-dependent fitness differences are sufficient to alter mutator success frequency by several orders of magnitude. These results indicate an unanticipated central role for the mutational spectrum in the evolution of bacterial mutation rates. At a practical level, this study indicates that knowledge of the molecular details of resistance determinants is crucial for minimizing mutator evolution during antibiotic therapy.


Conflict of interest statement

The authors have declared that no competing interests exist.

Figures

Figure 1
Figure 1. Mutational spectrum effects on generation of antibiotic-resistant mutants of wild-type and mutator E. coli.
(A) Characteristic colony size polymorphism generated by each strain in tetracycline (left), rifampicin (centre) and streptomycin (right). Resistance mutations to rifampicin and streptomycin impair bacterial growth to varying degrees, and are produced differentially according to mutational spectra. Tetracycline resistance serves here as a control, as resistance mutations in these strains show little variability for fitness. (B) Fitness distributions for antibiotic-resistant mutants generated by each strain. Histograms represent 42 independent growth rate estimations. Blue bars, ΔmutY (top); pink bars, ΔmutT (bottom). Wild-type reference values (grey bars) are placed behind those of each mutator. The greater diversity observed here compared to Figure 1A is a result of the larger number of independent cultures.
Figure 2
Figure 2. Antibiotic resistance mutations generated by wild-type and mutator strains.
Growth rate (mean ± SD; n = 3) of mutants bearing the specified mutation. Dark grey bars indicate mutations corresponding to the mutational spectrum of each mutator. Frequency of occurrence of each mutation is shown (right axis). All substitutions observed are described to confer antibiotic resistance. (A) Mutations in rpoB, which confer rifampicin resistance. (B) Mutations in rpsL, which confer streptomycin resistance.
Figure 3
Figure 3. Competition experiments for antibiotic-resistant mutants of wild-type and mutator E. coli.
Fitness (mean ± SD; n = 4) of antibiotic-resistant mutants generated by ΔmutY (circles) and ΔmutT (squares). Fitness was calculated relative to the wild-type strain; dashed line indicates equal competitive ability. Note that the relative abundance of competing mutants is anticipated to vary among replications, as mutants were generated stochastically during the growth period prior to competition.
Figure 4
Figure 4. Computer simulation of mutational spectrum effects on hitchhiking dynamics.
The mutational spectrum can bias the average fitness of mutants produced by a mutator compared to those produced by the wild-type strain. We modelled this bias as a multiplicative factor (σ), such that when σ = 1, there is no difference between the selective advantage conferred by the beneficial mutation on either background. Circles represent the frequency of trials in which a mutator allele escaped drift; triangles show the frequency of trials in which this allele reached fixation. Only slight variations in σ led to a profound effect on hitchhiking dynamics (see text for a definition of σ and a detailed explanation of the dynamics).
Figure 5
Figure 5. Mutational spectrum effect on hitchhiking dynamics.
Representative runs showing the change in frequency of the adapted wild-type (100) (blue) and the adapted mutator (101) (red), for σ = 1 (A–C) and σ = 1.8 (D–F). The beneficial mutation confers a 10% increase in relative fitness (sb = 0.2), whereas each deleterious mutation reduces it by 2% (sd = 0.04). All the results can be classified into three main cases: only the adapted wild-type escapes drift (A and D), both genotypes escape drift (B and E), or only the adapted mutator escapes drift (C and F). Numbers are the percentage of runs (of 35,000) that correspond to each case. A–C, Without mutational spectrum effects (σ = 1), in 90.1% of cases the much larger wild-type subpopulation generates an adapted genotype that reaches fixation before any adapted mutator is established (A). In the cases in which both adapted genotypes coexist (9.3% of the total), the wild-type is always fixed, due its lower deleterious load (B). This confines mutator success to the remaining 0.6% of cases, in which they are able to reach fixation before any adapted wild-type genotype escapes drift (C). D–F, When mutational spectrum effects are taken into account (σ = 1.8), mutators not only escape drift more frequently but, due to their higher fitness, they are able to reach fixation even in the presence of an adapted wild-type (E). As a result, there is a marked increase in the percentage of cases in which mutators become fixed (11.1%+1.1% = 12.2% versus 0.6% when σ = 1).

Similar articles

Cited by

References

    1. Boe L, Danielsen M, Knudsen S, Petersen JB, Maymann J, et al. (2000) The frequency of mutators in populations of Escherichia coli . Mutat Res 448: 47–55. - PubMed
    1. Funchain P, Yeung A, Stewart JL, Lin R, Slupska MM, et al. (2000) The consequences of growth of a mutator strain of Escherichia coli as measured by loss of function among multiple gene targets and loss of fitness. Genetics 154: 959–970. - PMC - PubMed
    1. LeClerc JE, Li B, Payne WL, Cebula TA (1996) High mutation frequencies among Escherichia coli and Salmonella pathogens. Science 274: 1208–1211. - PubMed
    1. Sniegowski PD, Gerrish PJ, Lenski RE (1997) Evolution of high mutation rates in experimental populations of E. coli. Nature 387: 703–705. - PubMed
    1. Mao EF, Lane L, Lee J, Miller JH (1997) Proliferation of mutators in a cell population. J Bacteriol 179: 417–422. - PMC - PubMed

Publication types