. 2013;9(1):e1003179.
doi: 10.1371/journal.pgen.1003179. Epub 2013 Jan 10.

A population genetic model for the maintenance of R2 retrotransposons in rRNA gene loci

Affiliations

A population genetic model for the maintenance of R2 retrotransposons in rRNA gene loci

Jun Zhou et al. PLoS Genet. 2013.

Abstract

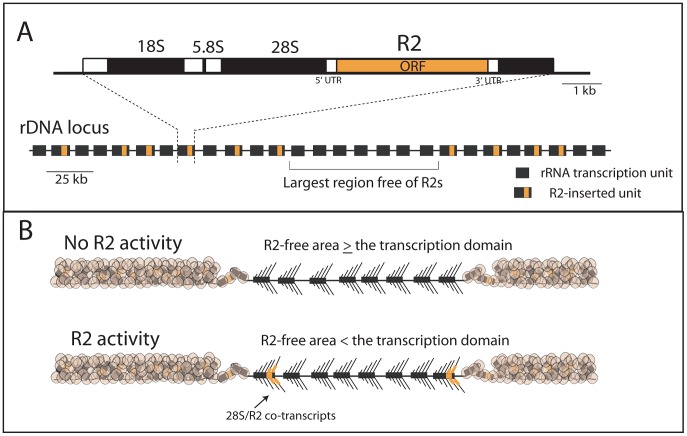
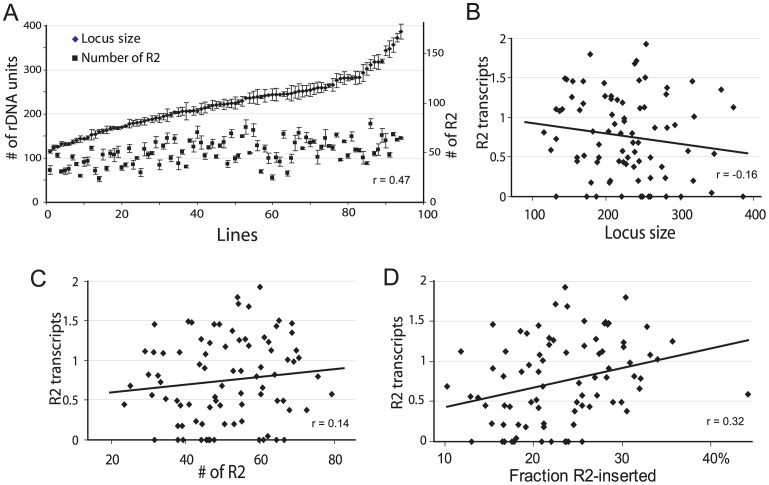
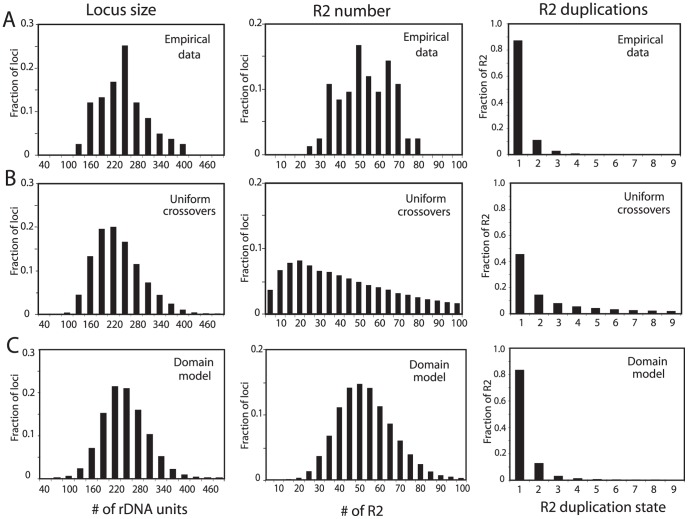
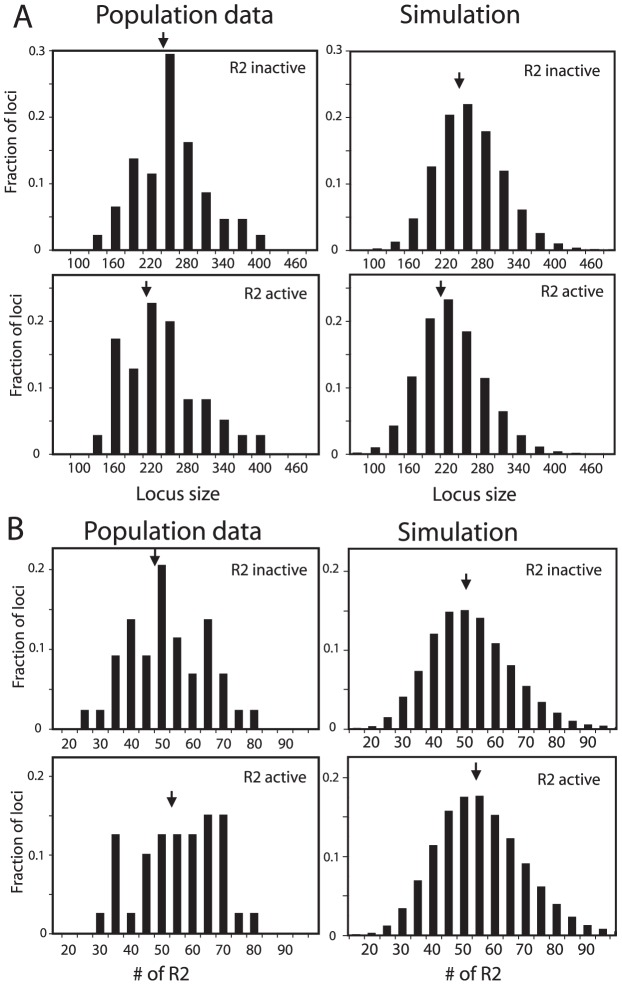
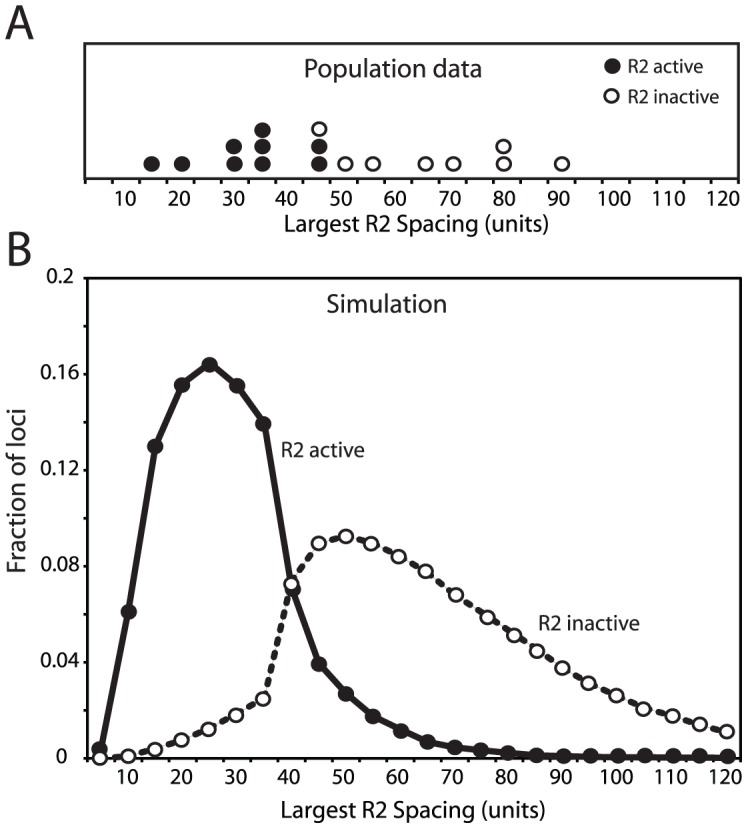
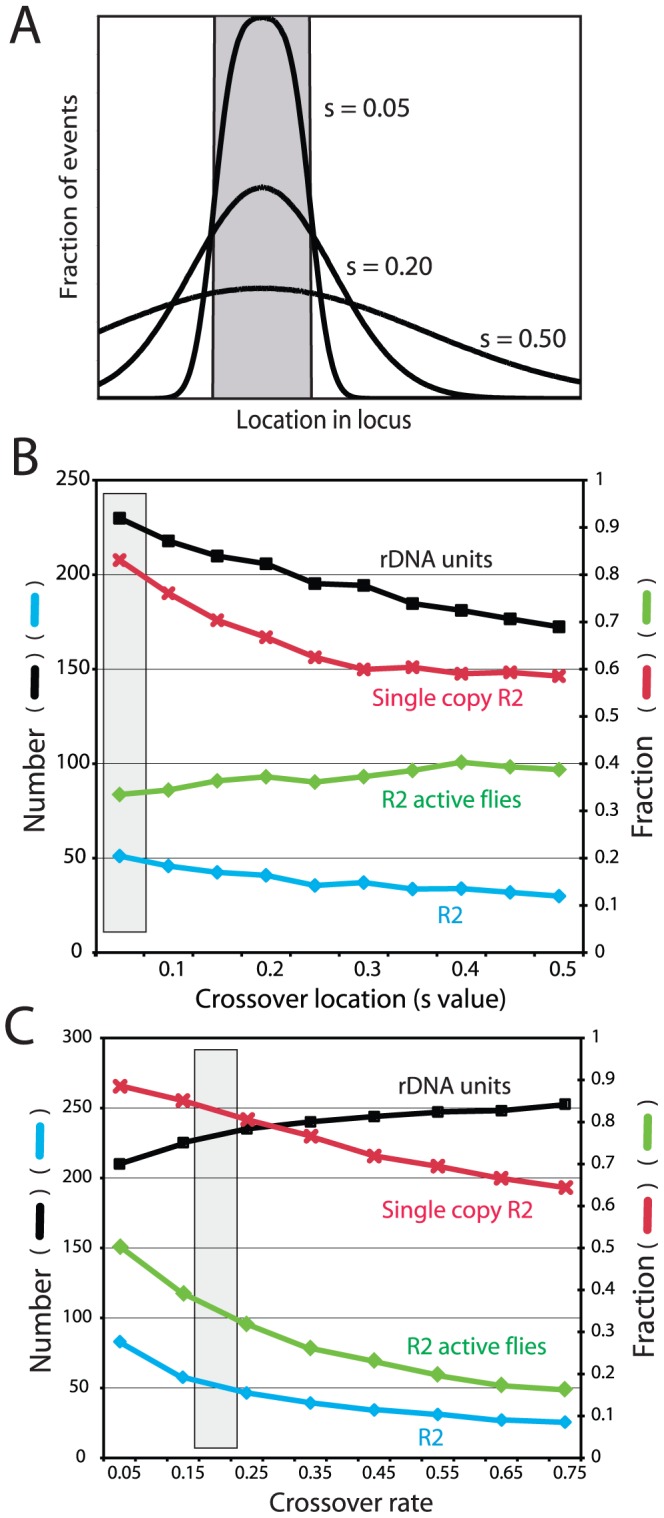
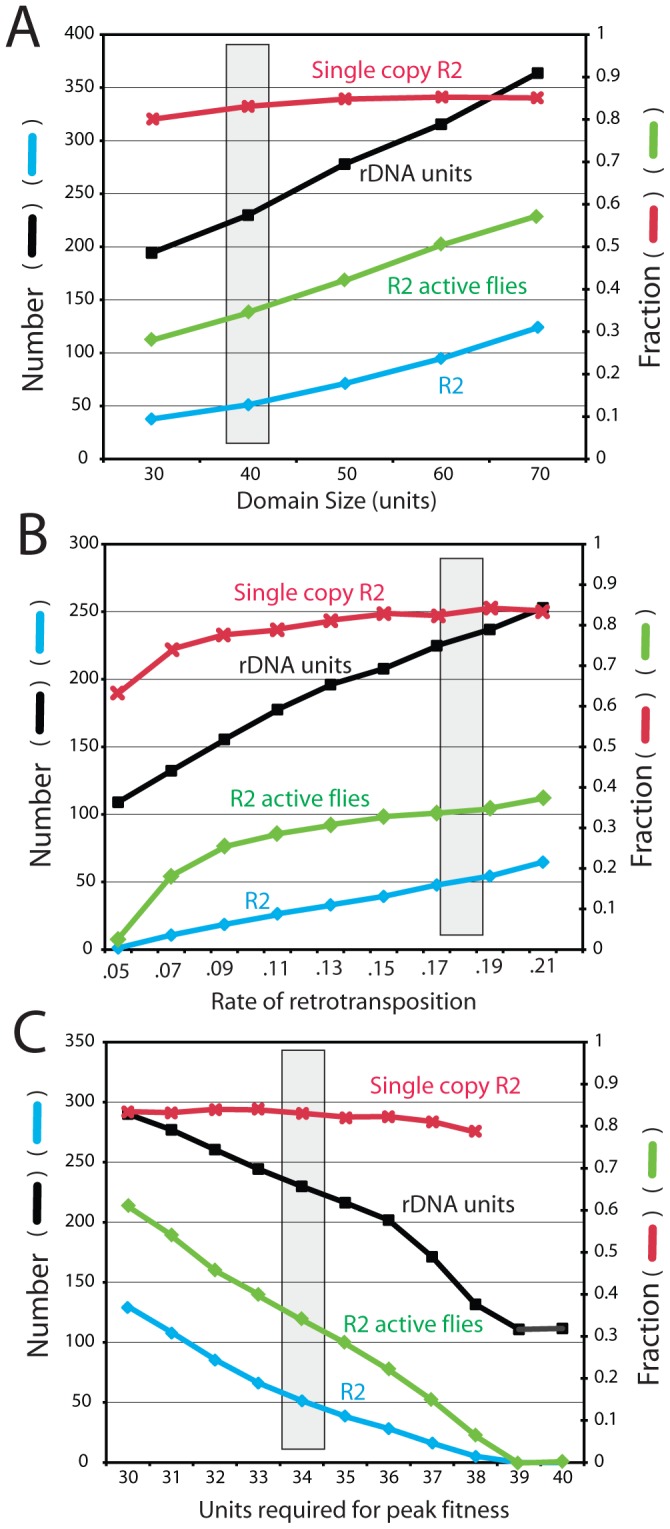
R2 retrotransposable elements exclusively insert into the tandemly repeated rRNA genes, the rDNA loci, of their animal hosts. R2 elements form stable long-term associations with their host, in which all individuals in a population contain many potentially active copies, but only a fraction of these individuals show active R2 retrotransposition. Previous studies have found that R2 RNA transcripts are processed from a 28S co-transcript and that the likelihood of R2-inserted units being transcribed is dependent upon their distribution within the rDNA locus. Here we analyze the rDNA locus and R2 elements from nearly 100 R2-active and R2-inactive individuals from natural populations of Drosophila simulans. Along with previous findings concerning the structure and expression of the rDNA loci, these data were incorporated into computer simulations to model the crossover events that give rise to the concerted evolution of the rRNA genes. The simulations that best reproduce the population data assume that only about 40 rDNA units out of the over 200 total units are actively transcribed and that these transcribed units are clustered in a single region of the locus. In the model, the host establishes this transcription domain at each generation in the region with the fewest R2 insertions. Only if the host cannot avoid R2 insertions within this 40-unit domain are R2 elements active in that generation. The simulations also require that most crossover events in the locus occur in the transcription domain in order to explain the empirical observation that R2 elements are seldom duplicated by crossover events. Thus the key to the long-term stability of R2 elements is the stochastic nature of the crossover events within the rDNA locus, and the inevitable expansions and contractions that introduce and remove R2-inserted units from the transcriptionally active domain.


Conflict of interest statement

The authors have declared that no competing interests exist.

Figures

Figure 1
Figure 1. Diagram of the rDNA locus and how the distribution of R2 gives rise to R2-active and R2-inactive individuals.
(A) rDNA loci are composed of tandem repeated rRNA genes with some 28S rRNA genes containing an R2 insertion. Each repeat contains one transcription unit with 18S, 5.8S and 28S rRNA genes (black bars) separated by spacer regions (open bars). R2 elements encode a large open reading frame, ORF, (orange bar) with short 5′ and 3′ untranslated regions (UTRs). The largest block of uninserted rDNA units is identified and determines what contiguous block of rDNA units are transcribed, the transcription domain. (B) The transcription domain model for the regulation of R2 activity is based on data suggesting that the host activates for transcription a contiguous block of rDNA units containing the fewest R2-inserted units , . The transcription domain is centered on the largest contiguous area of uninserted rDNA units. The remaining rDNA units are packaged into a transcriptionally inactive chromatin form. If the largest area free of R2 insertions is larger than the transcription domain, then no transcription of R2-inserted units occur. If the largest area free of R2 insertions is smaller than the transcription domain, then transcription of R2-inserted units does occur giving rise to retrotransposition events.
Figure 2
Figure 2. Properties of the rDNA loci derived from natural populations of D. simulans and their correlation with the level of R2 transcription.
(A) Range of rDNA locus size (diamonds) and R2 number (squares) for 95 iso-rDNA locus lines. The standard errors are shown for the six replicates conducted of each determination (see Materials and Methods). A positive correlation was found between the number of rDNA units (locus size) and the number of R2 (Spearman rank correlation r = 0.47, P = 10−8). (B) Using R2 transcript levels previously determined for these same lines , no correlation was found between the locus size and the R2 transcript levels (r = −0.16, P = 0.142). (C) No correlation was also found between the number of R2 and the R2 transcript level (r = 0.14, P = 0.187). (D) A small but significant correlation was found between the fraction of the rDNA units inserted with R2 elements and R2 transcript levels (r = 0.32, P = 0.003).
Figure 3
Figure 3. Comparison of the rDNA loci from natural populations with computer simulated loci generated by simple crossover models of concerted evolution.
(A) The empirical data determined for rDNA loci from the natural populations in Figure 2 are re-plotted to show the distributions of rDNA locus size (left panel), total R2 number per locus (middle panel), and the number of R2 copies duplicated by crossovers (right panel). The R2 duplication frequency was derived from the approach used in ref. 20 to count the total number of R2 copies in 18 rDNA loci. (B) Simulation data based on the modeling approach described in ref. 17 in which the crossover events are uniformly distributed throughout the rDNA locus. The following parameters were used. Population size = 4000; generations = 10000; replicates = 60; number of uninserted rDNA units required for peak fitness = 100; maximum fecundity = 6; SCE rate = 0.3; ICE rate = 0.0001; crossover offset = 1–8 rDNA units; R2 retrotransposition rate = 0.009 for all loci containing R2 elements; loop deletion rate = 0.00005; deletion size = 1–15 rDNA units. See Materials and Methods for a description of these parameters. How these parameters influence the size of the rDNA locus and number of inserted units can be found in ref. 17. The three panels showing the distributions of locus size, number of R2, and R2 duplication state are shown below the corresponding data from the natural populations. (C) Simulation data based on the transcription domain model for the regulation of R2 elements in a population. The following parameters were used (also described in the Materials and Methods). Population size = 5000; generations = 50000; replicates = 60; transcription domain size = 40; number of uninserted rDNA units in the domain required for peak fitness = 34; maximum fecundity = 6; SCE rate = 0.2 and clustered near the transcription domain with s = 0.05; ICE rate = 0.0001, s = 0.05; crossover offset = 1–11 rDNA units; R2 retrotransposition rate = 0.18 times a square root function of the number of full-length R2 copies in the domain, s = 0.4; loop deletion rate = 0.00007 times the size of the rDNA locus; element induced deletion rate = 0.0065 times the number of full-length R2 copies in the domain; deletion size = 1–30 rDNA units, s = 0.2. The panels containing the distributions of locus size, the number of R2, and R2 duplication state are again shown below the corresponding data from the natural populations.
Figure 4
Figure 4. Comparison of the rDNA locus size and R2 number in R2-active and R2-inactive individuals.
(A) Distribution of rDNA locus size. Left panels, the D. simulans lines shown in Figure 3A were divided into R2-active and R2-inactive pools based on whether full-length R2 transcripts (at least 5 times above background hybridization) had been detected on Northern plots . Right panels, the simulated rDNA loci from Figure 3C were divided into R2-active and R2-inactive pools based on whether a full-length R2 element was present in the transcription domain in the last generation of the simulation. Arrows in all panels indicate mean locus size for the group. The distribution of locus size in the simulated data matched that of the empirical data (Kolmogorov-Smirnov test, P = 0.50 for the R2 active flies, and P = 0.16 for the R2 inactive flies). (B) As in panel A except the distribution of the total number of R2 elements in each locus is plotted for each pool. The distribution of R2 number in the simulated data again closely matched that of the empirical data (K-S test, P = 0.94 for the R2 active flies, and P = 0.99 for the R2 inactive flies).
Figure 5
Figure 5. Comparison of the largest region of the rDNA locus free of R2-inserted units in the R2-active and R2-inactive individuals.
(A) The empirical data for 17 D. simulans lines was determined by pulsed-field gel electrophoresis of NotI-digested high molecular weight DNA , . The restriction enzyme, NotI, cleaves a site in the R2 element but no sites are located within the uninserted rDNA units. An uninserted rDNA unit in D. simulans is about 11 kb in length . (B) The largest region of each rDNA locus generated by the domain model simulations is shown. The parameters used in the simulations were identical to those in Figure 3C and Figure 4. In both panel A and B R2-active lines (filled circles) and the R2-inactive lines (open circles) were defined as in Figure 4.
Figure 6
Figure 6. Effects of varying crossover location and crossover frequency on the properties of the simulated rDNA loci.
(A) Diagram of how crossovers were localized in the rDNA loci. The gray box represents the transcription domain. For each locus this domain was centered on the region with the fewest R2-inserted units (see Figure 5S for the distribution of domains within the loci). For each simulation crossovers were assigned a standard deviation of location from the domain, S value, ranging from mostly within the transcription domain to more broadly throughout the locus. (B) Simulations in which the distribution of crossover location (S value) was varied while all other parameters were held constant. Four properties of the loci were recorded at the end of each simulation: black symbols, the mean rDNA locus size; blue symbols, the mean number of R2 elements; red symbols, the fraction of the R2 elements that were single copy (i.e. not duplicated by a crossover event); and green symbols, the fraction of individuals in the population with active R2 elements. The gray box represents the parameters used for the simulations in Figure 3, Figure 4 and Figure 5. (C) Simulations in which the frequency of sister chromatid crossovers events was varied. Units are crossovers/loci/generation. All symbols and the gray box are as described in B.
Figure 7
Figure 7. Effects of varying the transcription domain size, retrotransposition rate, and selection against inserted units.
The four properties of the rDNA loci are as described in Figure 6. The gray box represents the parameters used for the simulations in Figure 3, Figure 4 and Figure 5. (A) Simulations in which the size of the transcription domain (number of rDNA units transcribed in each individual) was varied. (B) Simulations varying the rate of R2 retrotransposition. The retrotransposition rate was determined for each individual in the population at each generation. This rate was dependent on the square root function of the number of full-length R2 elements present within the transcription domain multiplied by the probabilities shown. Probabilities below 0.05 events per element within the domain per generation could not maintain R2 elements within the populations. (C) Simulations measuring the consequences of varying the number of uninserted units needed within a 40-unit transcription domain to obtain peak fitness. See Materials and Methods for how the extent of fitness reduction was calculated. A requirement of 39 and 40 uninserted units for peak fitness eliminated all R2 elements from the rDNA loci of the populations.

Similar articles

Cited by

References

    1. Eickbush TH, Eickbush DG (2007) Finely orchestrated movements: evolution of the ribosomal RNA genes. Genetics 175: 477–485. - PMC - PubMed
    1. Conconi A, Widmer RM, Koller T, Sogo JM (1989) Two different chromatin structures coexist in ribosomal RNA genes throughout the cell cycle. Cell 57: 753–761. - PubMed
    1. Dammann R, Lucchini R, Koller T, Sogo JM (1995) Transcription in the yeast rRNA gene locus: distribution of the active gene copies and chromatin structure of their flanking regulatory sequences. Mol Cell Biol 15: 5294–5303. - PMC - PubMed
    1. Ye J, Eickbush TH (2006) Chromatin structure and transcription of the R1- and R2-inserted rRNA genes of Drosophila melanogaster . Mol Cell Biol 26: 8781–8790. - PMC - PubMed
    1. Eickbush TH (2002) R2 and Related Site-specific non-LTR Retrotransposons. pp. 813–835. In Mobile DNA II, N. Craig, R. Craigie, M. Gellert, and A Lambowitz, eds. American Society of Microbiology Press. Washington D.C.

Publication types

LinkOut - more resources