. 2013;8(1):e47434.
doi: 10.1371/journal.pone.0047434. Epub 2013 Jan 11.

Neem leaf glycoprotein activates CD8(+) T cells to promote therapeutic anti-tumor immunity inhibiting the growth of mouse sarcoma

Affiliations

Neem leaf glycoprotein activates CD8(+) T cells to promote therapeutic anti-tumor immunity inhibiting the growth of mouse sarcoma

Atanu Mallick et al. PLoS One. 2013.

Abstract

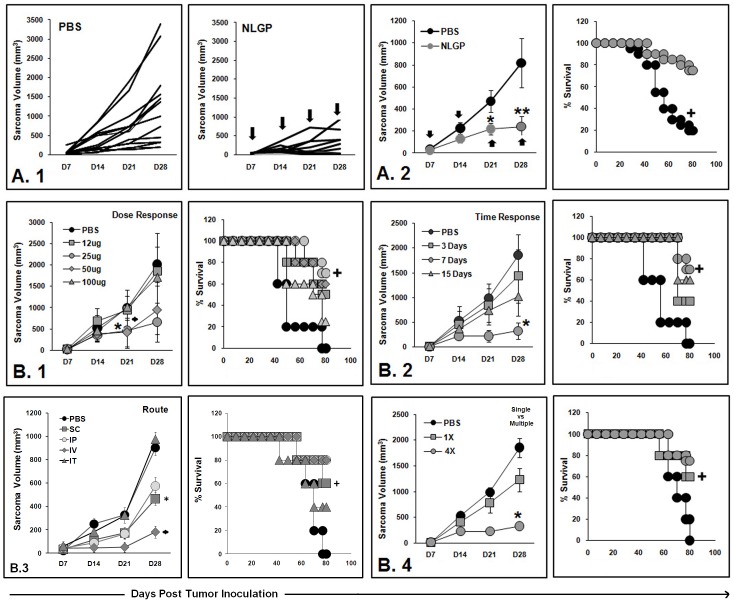
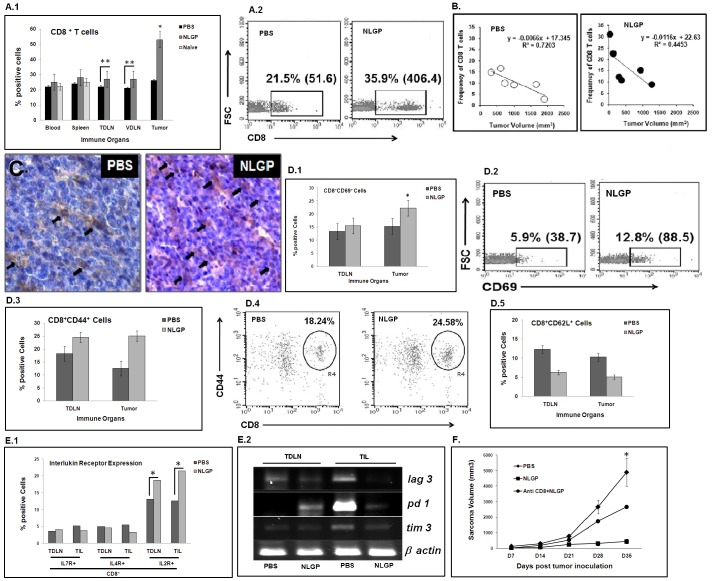
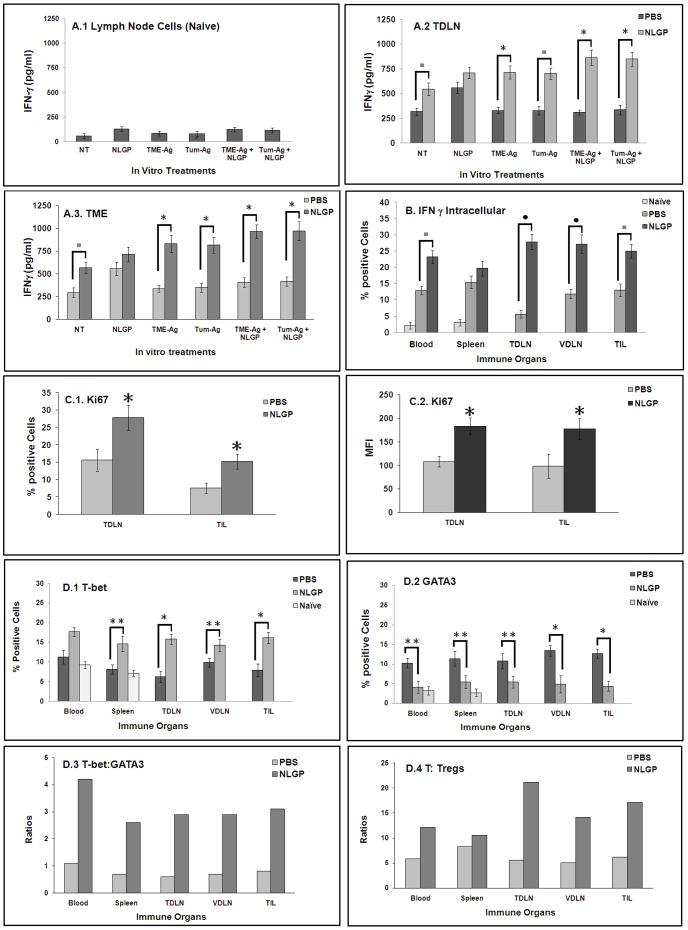
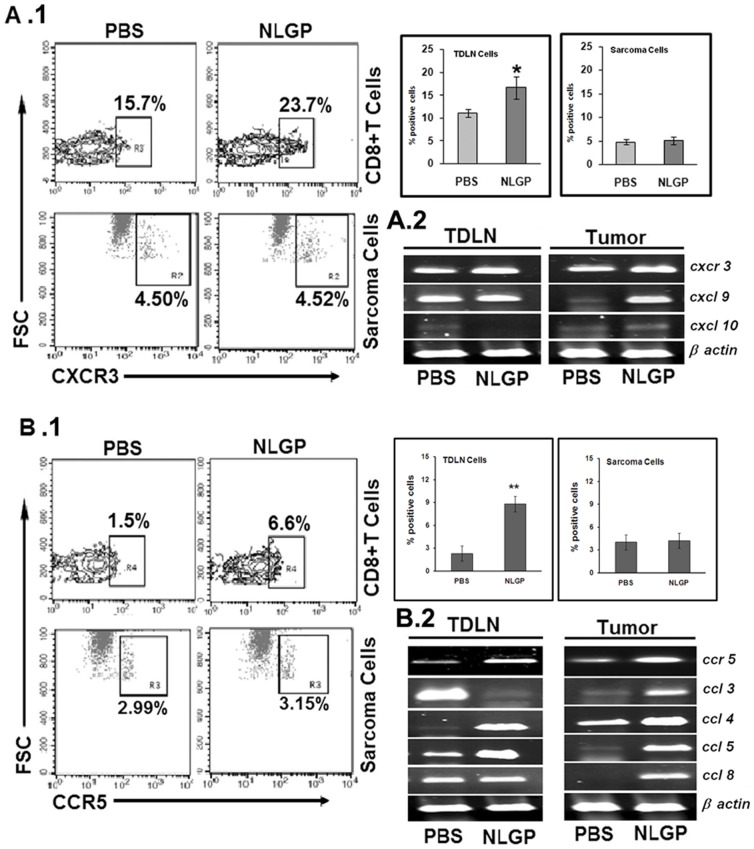
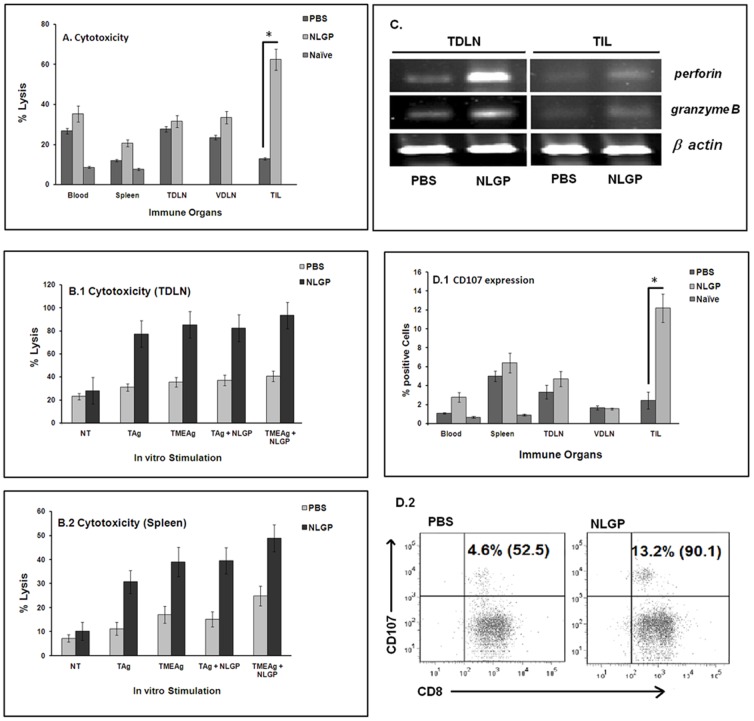
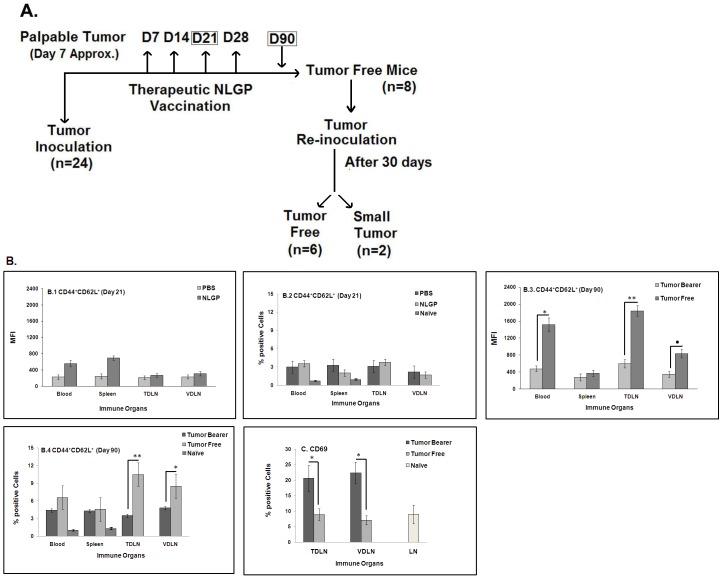
In spite of sufficient data on Neem Leaf Glycoprotein (NLGP) as a prophylactic vaccine, little knowledge currently exists to support the use of NLGP as a therapeutic vaccine. Treatment of mice bearing established sarcomas with NLGP (25 µg/mice/week subcutaneously for 4 weeks) resulted in tumor regression or dormancy (Tumor free/Regressor, 13/24 (NLGP), 4/24 (PBS)). Evaluation of CD8(+) T cell status in blood, spleen, TDLN, VDLN and tumor revealed increase in cellular number. Elevated expression of CD69, CD44 and Ki67 on CD8(+) T cells revealed their state of activation and proliferation by NLGP. Depletion of CD8(+) T cells in mice at the time of NLGP treatment resulted in partial termination of tumor regression. An expansion of CXCR3(+) and CCR5(+) T cells was observed in the TDLN and tumor, along with their corresponding ligands. NLGP treatment enhances type 1 polarized T-bet expressing T cells with downregulation of GATA3. Treg cell population was almost unchanged. However, T∶Treg ratios significantly increased with NLGP. Enhanced secretion/expression of IFNγ was noted after NLGP therapy. In vitro culture of T cells with IL-2 and sarcoma antigen resulted in significant enhancement in cytotoxic efficacy. Consistently higher expression of CD107a was also observed in CD8(+) T cells from tumors. Reinoculation of sarcoma cells in tumor regressed NLGP-treated mice maintained tumor free status in majority. This is correlated with the increment of CD44(hi)CD62L(hi) central memory T cells. Collectively, these findings support a paradigm in which NLGP dynamically orchestrates the activation, expansion, and recruitment of CD8(+) T cells into established tumors to operate significant tumor cell lysis.


Conflict of interest statement

Competing Interests: The authors have declared that no competing interests exist.

Figures

Figure 1
Figure 1. Tumor growth and survivability of NLGP-treated mice.
A.1. Swiss mice were inoculated with Sarcoma 180 cells (1×10⁶ cells/mice). After formation of palpable tumor, mice of experimental group (n = 24) were treated with NLGP (25 µg) once a week for 4 weeks in total and other control group (n = 24) received PBS only. Pattern of tumor growth (in mm3) of each mouse is presented till day 28 after the initiation of therapy. Arrows indicate the points of NLGP injection A.2. Mice were inoculated with s.c. sarcoma and after formation of tumors mice of experimental group were treated with NLGP (25 µg) once a week for 4 weeks in total. Mean tumor volume of PBS- and NLGP-treated mice is presented (n = 24, in each case) (*p<0.05; **p<0.001), along with their mean survival till day 90 (+ p<0.001). B.1. Mice were inoculated with Sarcoma 180, after formation of palpable tumors, mice were randomly divided into five groups (n = 6, in each group) and treated with different doses of NLGP (12 µg, 25 µg, 50 µg and 100 µg) once a week for 4 weeks in total and PBS for fifth group. Tumor growth curve (*p<0.01 for 25 µg; p<0.01 for 50 µg) and their mean survival are presented (+ p<0.01). B.2. Mice were inoculated with Sarcoma 180; after the formation of the palpable tumors, mice were randomly grouped into four (n = 6, in each group) and treated with NLGP (25 µg) s.c. for various time intervals (3 days, 7 days and 15 days) and 4 injections were given in each treatment cohort. Fourth group was kept untreated. Tumor growth curve (*p<0.001) and their mean survival (+ p<0.01) are presented. B.3. Mice were inoculated with Sarcoma 180; after the formation of the palpable tumors, mice were randomly grouped into five (n = 6, in each group) and treated with NLGP, through different routes (subcutaneous, intraperitoneal, intravenous and intratumoral) once a week for 4 weeks in total. Tumor growth curve (*p<0.01, s.c. and i.p.; p<0.01, iv) and their mean survival (+ p<0.01) are presented. B.4. Mice were inoculated with Sarcoma 180; after the formation of the palpable tumors, mice were randomly grouped into three (n = 6, in each group) and treated with NLGP (25 µg) (single vs four weekly injections). Tumor growth curve (*p<0.001) and their mean survival (+ p<0.01) are presented.
Figure 2
Figure 2. NLGP mediated tumor growth restriction and CD8+ T cells.
Mice were inoculated with Sarcoma 180 tumor cells (1×10⁶ cells/mice); after the formation of palpable tumor, mice were treated with NLGP (25 µg) once in a week, and four injections in total. A.1. Different immune organs (Blood, Spleen, TDLN, VDLN) and tumors were harvested on day 21 after initiation of therapy, lymphocytes were isolated, labeled with CD8-PE and percentage of CD8+ T cells were analyzed by flow cytometry, along with blood and spleen cells from naive mice. *p<0.001; **p<0.05. A.2. Representative dot plots of CD8 positivity of TILs harvested from tumor of PBS- and NLGP-treated mice. B. Tumor volume of PBS- and NLGP-treated mice was plotted against percentage of CD8+ cells. C. Presence of CD8+ T cells was detected on cryosections of tumor tissues from either PBS or day 21 NLGP-treated mice by immunohistochemistry. D.1. MNCs from TDLN and tumors were harvested from mice with day 21 tumors and stained for CD8+CD69+. *p<0.05. D.2. CD8+ cells within MNCs of PBS- and NLGP-treated mice were gated and CD69+ cells were identified within this gated population as presented by dot plots. D.3. MNCs from TDLN and tumors were harvested from mice with day 21 tumors and stained for CD8+CD44+. D.4. A representative dot plot for CD8+CD44+ cells within MNCs of PBS- and NLGP-treated mice. D.5. MNCs from TDLN and tumors were harvested from mice with day 21 tumors and stained for CD8+CD62L+ cells. E.1. Expression of cytokine receptors, like, IL-7R, IL-4R and IL-2R, on cells from TDLN and TIL of NLGP-treated mice was determined flow cytometrically. E.2. Expression of T cell exhaustion markers, like, lag3, pd1 and tim3, in cells from TDLN and TIL of NLGP-treated mice was determined at transcriptional level by RT-PCR. F. CD8+ cells were depleted in NLGP-treated mice, along with PBS (negative) and NLGP (positive) treatment into two other groups as controls. Tumor growth curve is presented. *p<0.001, in comparison to NLGP-treated group.
Figure 3
Figure 3. IFNγ secretion from immune cells of NLGP-treated tumor bearing mice.
Mice were inoculated with Sarcoma 180 cells (1×10⁶ cells/mice) and after the formation of palpable tumor mice of experimental group were treated (s.c.) with NLGP once a week. Mice were sacrificed on day 21 to collect TDLN and tumor and MNCs were purified. A. Cells from lymph nodes of naïve mice (A.1), TDLNs (A.2) and tumors (A.3) were cultured in vitro for 48 h in presence of NLGP, TME-Ag, Tum-Ag, TME-Ag+NLGP, Tum-Ag+NLGP in RPMI 1640. Culture supernatants were assessed for IFNγ release by ELISA. *p<0.01; p<0.05. B. Intra-cellular IFNγ expression of CD8+ T-cells in different immune compartments (from either PBS- or NLGP-treated group and from blood and spleen cells of naïve mice) was analyzed by flow cytometry. p<0.01; p<0.05. C. MNCs isolated from TDLN and TIL of PBS- and NLGP-treated mice were labeled to detect the proliferation specific marker, Ki67, along with CD8+ cells. Percentage of proliferated cells within CD8 gated population and their MFI were presented. *p<0.01. D. Mice were inoculated with Sarcoma 180 cells (1×10⁶ cells/mice) and after formation of palpable tumor, mice of experimental group were treated with NLGP once a week. Mice were sacrificed on day 21 to collect blood, spleen, TDLN, VDLN and tumor and CD8+ T cells were purified from MNCs. Blood and spleen cells were also harvested from naive mice. Purified CD8+ T cells were intracellularly stained with anti-T-bet (D.1) and anti-GATA3 (D.2) antibodies to analyze through flow cytometry. Percent of T-bet and GATA3 positive cells from different immune organs is presented. *p<0.001; **p<0.01. Ratio between T-bet vs GATA3 (D.3) and T cells vs Tregs (D.4) is shown.
Figure 4
Figure 4. CXCR3, CCR5 expression on CD8+ T cells (from TDLN) and sarcoma cells.
Mice were inoculated with Sarcoma 180 cells (1×10⁶ cells/mice) and after formation of palpable tumor mice of experimental group were treated with NLGP (25 µg) once a week s.c. for 4 weeks in total. Mice were sacrificed on day 21 to collect TDLN and MNCs were purified. CD8+ T cells (upper panel, low FSC) and sarcoma cells (lower panel, high FSC) with or without NLGP treatment were stained with anti-CXCR3 (A.1) and anti-CCR5 (B.1) antibodies. Representative dot plots in each case (left panel) and bar diagrams (right panel) showing mean±SD values of six individual observations are presented. *p<0.01; **p<0.05. Total RNA was isolated from T cells of TDLN and tumor of the same PBS- and NLGP-treated mice and cxcr3 and its ligands, e.g., cxcl9, cxcl10 were analyzed at transcriptional level (A.2). Similarly, mRNA for ccr5 and corresponding ligands, e.g., ccl3, ccl4, ccl5 and ccl8, were also assessed (B.2).
Figure 5
Figure 5. In vitro cytotoxicity of sarcoma by immune cells from NLGP-treated mice.
Mice were inoculated with Sarcoma 180 cells (1×10⁶ cells/mice) and after formation of palpable tumor, mice of experimental group were treated with NLGP once a week. Mice were sacrificed on day 21 to collect blood, spleen, TDLN, VDLN and tumor and MNCs were purified. MNCs are also purified from blood and spleen of naive mice. MNCs were co-cultured with sarcoma cells in 1∶10 ratios for 24 hrs and released LDH was measured (A). *p<0.001. MNCs from TDLN (B.1) and Spleen (B.2) of PBS- and NLGP- treated sarcoma bearing mice were cultured in vitro in presence of IL-2 for 4 days and further stimulated with tumor (sarcoma) antigens (5 µg/ml) for 2 days with or without NLGP. Antigens from tumor as well as its microenvironment were extracted from intra-peritoneally grown sarcoma (Tum-Ag) and from solid tumor (TME-Ag). Cytotoxic efficacy of activated T-cells was analyzed towards Sarcoma 180 cells by LDH release assay. C. Total RNA was isolated from MNCs of TDLN and tumor from PBS- and NLGP-treated mice on day 21 and cytotoxicity related genes (perforin and granzymeB) were analyzed at transcriptional level by RT-PCR. D. MNCs from all immune compartments were incubated with sarcoma cells to detect CD107a expression by intracellular flow cytometric staining. Data is presented in bar diagram (*p<0.001) (D.1) and a representative dot plot for CD107a expression from TILs is also shown (D.2).
Figure 6
Figure 6. Memory response in sarcoma bearing mice after NLGP therapy.
A. A flow chart explaining the experimental design to understand the generation of memory response following NLGP therapy and re-inoculation with sarcoma in tumor free mice. Mice were inoculated with Sarcoma 180 cells and after formation of palpable tumor mice of the experimental group were treated with NLGP (25 µg) once a week for 4 weeks in total. A group of mice was sacrificed on day 21 to collect blood, spleen, TDLN and VDLN. MNCs were purified to stain with CD44 and CD62L antibodies, along with staining for CD8+ T cells, in comparison to cellular components obtained from PBS injected sarcoma bearing mice. Expression on blood, spleen and lymph node cells from naive mice was also studied. Both status of % positive cells (B.2) and MFI (B.1) are shown. Mice were inoculated with Sarcoma 180 cells and after the formation of palpable tumor, mice of experimental group were treated with NLGP (25 µg) once a week for 4 weeks in total. Tumor free mice were selected following 90 days of the initiation of therapy and re-inoculated with sarcoma. Blood, Spleen, TDLN and VDLN were isolated from representative mice of same group on day 90 and MNCs were purified to stain with CD44 and CD62L antibodies, in comparison to cellular components obtained from untreated sarcoma bearing mice. Both status of % positive cells (B.4) and MFI (B.3) are shown. In experiments described in B.1–B.4, CD8+ cells were first gated and CD44+CD62L+ cells within this population were then analyzed. *p<0.01; **p<0.001; p<0.05. Percentage of CD69+ cells were analyzed within CD8+ cells from TDLN and VDLN on day 90 of identical experimental settings, mentioned in B. *p<0.01. Expression of CD69 on CD8+ T cells from lymph node of naive mice is also shown (C).

Similar articles

Cited by

References

    1. Higham EM, Shen CH, Wittrup KD, Chen J (2010) Cutting edge: delay and reversal of T cell tolerance by intratumoral injection of antigen-loaded dendritic cells in an autochthonous tumor model. J Immunol 184: 5954–5958. - PMC - PubMed
    1. Kurosaki M, Horiguchi S, Yamasaki K, Uchida Y, Motohashi S, et al. (2011) Migration and immunological reaction after the administration of αGalCer-pulsed antigen-presenting cells into the submucosa of patients with head and neck cancer. Cancer Immunol Immunother 60: 207–215. - PMC - PubMed
    1. Sampson JH, Schmittling RJ, Archer GE, Congdon KL, Nair SK, et al. (2012) A pilot study of IL-2Rα blockade during lymphopenia depletes regulatory T-cells and correlates with enhanced immunity in patients with glioblastoma. PLoS One 7: e31046. - PMC - PubMed
    1. Angevin E, Kremer F, Gaudin C, Hercend T, Triebel F (1997) Analysis of T-cell immune response in renal cell carcinoma: polarization to type 1-like differentiation pattern, clonal T-cell expansion and tumor-specific cytotoxicity. Int J Cancer 72: 431–440. - PubMed
    1. Le X, Wei D, Huang S, Lancaster JR Jr, Xie K (2005) Nitric oxide synthase II suppresses the growth and metastasis of human cancer regardless of its up-regulation of protumor factors. Proc Natl Acad Sci USA 102: 8758–8763. - PMC - PubMed

Publication types

MeSH terms