. 2013;8(1):e49709.
doi: 10.1371/journal.pone.0049709. Epub 2013 Jan 9.

The transcription factor Sp3 regulates the expression of a metastasis-related marker of sarcoma, actin filament-associated protein 1-like 1 (AFAP1L1)

Affiliations

The transcription factor Sp3 regulates the expression of a metastasis-related marker of sarcoma, actin filament-associated protein 1-like 1 (AFAP1L1)

Yoichiro Kajita et al. PLoS One. 2013.

Abstract

We previously identified actin filament-associated protein 1-like 1 (AFAP1L1) as a metastasis-predicting marker from the gene-expression profiles of 65 spindle cell sarcomas, and demonstrated the up-regulation of AFAP1L1 expression to be an independent risk factor for distant metastasis in multivariate analyses. Little is known, however, about how the expression of AFAP1L1 is regulated. Luciferase reporter assays showed tandem binding motives of a specificity protein (Sp) located at -85 to -75 relative to the transcriptional start site to be essential to the promoter activity. Overexpression of Sp1 and Sp3 proteins transactivated the proximal AFAP1L1 promoter construct, and electrophoretic mobility shift assays showed that both Sp1 and Sp3 were able to bind to this region in vitro. Chromatin immunoprecipitation experiments, however, revealed that Sp3 is the major factor binding to the proximal promoter region of the AFAP1L1 gene in AFAP1L1- positive cells. Treatment with mithramycin A, an inhibitor of proteins binding to GC-rich regions, prevented Sp3 from binding to the proximal promoter region of AFAP1L1 and decreased its expression in a dose-dependent manner. Finally, knocking down Sp3 using small inhibitory RNA duplex (siRNA) reduced AFAP1L1 expression significantly, which was partially restored by expressing siRNA-resistant Sp3. These findings indicate a novel role for Sp3 in sarcomas as a driver for expression of the metastasis-related gene AFAP1L1.


Conflict of interest statement

Competing Interests: The authors have declared that no competing interests exist.

Figures

Figure 1
Figure 1. AFAP1L1 expression in sarcoma cell lines.
(A) mRNA expression of the AFAP1L1 gene in sarcoma cell lines. Reverse transcribed cDNA from each cell line was used as a template for PCR with primers specific for the AFAP1L1 gene. The β-actin gene was used as a control. (B) Quantitative analysis of the gene expression of AFAP1L1. qPCR was performed with a Taqman probe and the primers listed in Table S1. Expression levels were calculated as fold changes relative to U2OS. (C) Protein expression of AFAP1L1. Total cell lysate from each cell line was used for Western blotting. β-tubulin was used as a control. Error bars indicate standard deviations.
Figure 2
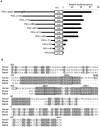
Figure 2. Identification of the core promoter region of the AFAP1L1 gene.
(A) Transcriptional activity of the 5′-flanking region of the AFAP1L1 gene. Luciferase reporter assays were performed using a series of constructs carrying DNA fragments derived from the 5′-flanking region of the AFAP1L1 gene. Numbers indicate the position relative to the transcriptional start site (TSS), and in all cases, the 3′ end of fragments was at the start codon, which was located 75 bases upstream of TSS. (B) Comparison of 5′-flanking region of the AFAP1L1 gene among species. Human, mouse and rabbit sequences of the 5′-flanking region of the AFAP1L1 gene are aligned, and conserved sequences are shown in gray boxes. EBS, Ets-binding site; SBS, Sp1-binding site.
Figure 3
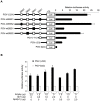
Figure 3. Identification of Sp1-binding sites as essential sequences for AFAP1L1 transcription.
(A) Identification of core domains for transcriptional activity. Open and closed circles represent wild-type and mutated EBS and open and closed rectangles represent wild-type and mutated SBS. PGV-vectors containing various segments of the AFAP1L1 promoter were transfected into U2OS cells, and their luciferase activities were measured. (B) The effect of exogenous Sp1 and Sp3 on the transcriptional activity of the core promoter region of the AFAP1L1 gene. The luciferase activity of the core promoter region (−224 to +75) was evaluated after Sp1 or Sp3-expressing vectors were co-transfected into U2OS cells. The total amount of transfected plasmid DNA was equalized by the addition of pcDNA3.1(+), an empty vector. Error bars indicate standard deviations.
Figure 4
Figure 4. Binding of Sp transcription factors to the core-promoter region of the AFAP1L1 gene in vitro.
EMSA was performed to analyze the binding ability of putative transcription binding sites. Nuclear extracts were prepared from U2OS cells. Cold competitor experiments were conducted by the addition of 25- and 50-fold excess amounts of unlabeled SBS1WT or SBS1MUT to nuclear extracts before incubating with labeled SBS1WT (lanes cf). Supershift experiments were conducted by the addition of anti-Sp1 or anti-Sp3 antibody to protein-OND complexes (lanes g and h). Non-immune IgG was used as a control (lane i). Open and closed arrowheads indicate the Sp3-OND and Sp1-OND complex, respectively. Single and double asterisks indicate bands supershifted by the addition of Sp1 or Sp3 antibody, respectively.
Figure 5
Figure 5. Identification of Sp3 as a major transcription factor for AFAP1L1.
(A) and (B) Binding of Sp transcription factors to the core-promoter region of the AFAP1L1 gene in vitro. ChIP assays were performed using anti-Sp1 and anti-Sp3 antibodies or control IgG and the precipitated DNA was PCR-amplified using a pair of primers located in the core-promoter region (Table S1) (A), and the precipitated genome was quantified by qPCR (B). (C) The effect of mithramycin A treatment on Sp3 binding. U2OS cells were treated with mithramycin A or DMSO for 48 h, and immunoprecipitated DNA by Sp3 antibody was quantified by qPCR. (D) The effect of mithramycin A on the expression of the AFAP1L1 gene. RNA was extracted from U2OS cells treated with mithramycin A or DMSO for 48 h, and RT-PCR was performed to semi-quantify the expression of each gene. The β-actin and GAPDH genes were used as a control. Error bars indicate standard deviations.
Figure 6
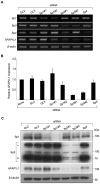
Figure 6. Linking of Sp3 with AFAP1L1 by siRNA experiments.
(A) The specificity of siRNA. U2OS cells were treated with siRNA targeting Sp1, Sp3, or Sp4 for 48 h, and the expression of these genes as well as the AFAP1L1 gene was analyzed by PCR. Two different siRNAs targeting the Sp1 and Sp3 genes were designed and used. β-actin was used as a control. (B) Down-regulation of AFAP1L1 expression by siRNA targeting the Sp3 gene at the mRNA level. U2OS cells were treated with siRNAs targeting each gene for 48 h and the expression of AFAP1L1 was analyzed by qPCR and indicated as fold changes relative to that in untreated cells. (C) Down-regulation of AFAP1L1 expression by siRNA targeting the Sp3 gene at the protein level. U2OS cells were treated with siRNA targeting each gene for 72 h and proteins were extracted and used for Western blotting. β-tubulin was used as a control.
Figure 7
Figure 7. Restoration of down-regulated AFAP1L1 expression by an siRNA-resistant Sp3 expression vector.
U2OS cells stably expressing the Sp3 mRNA resistant to Sp3#1 and Sp3#2 siRNA was established and treated with these siRNAs. U2OS cells stably expressing the EGFP or LacZ gene were employed as a control. After 48-h-treatment with siRNAs, RNA was extracted from each cell and the expression of Sp3 and AFAP1L1 was analyzed by RT-PCR (A). Knocking down of the endogenous Sp3 gene was confirmed by PCR using a set of primers located in the 3′ UTR of the Sp3 gene (Table S1). The β-actin gene was used as a control. Protein was extracted after 72 h of treatment and used for Western blotting (B). β-tubulin was used as a control. Error bars indicate standard deviations. Single and double asterisks indicate the long and short forms of the Sp3 protein, respectively.
Figure 8
Figure 8. Inhibition of Sp3 expression reduces cell migration and invasiveness in U2OS cells.
Numbers of cells migrating through the uncoated 8-micron membrane pores (A) and through the Matrigel-coated membranes (B) were counted in five randomly chosen fields at a magnification of ×100. (C) A cell invasion index was calculated as the ratio of the number of cells migrating through the matrigel to the number migrating through the uncoated membrane.

Similar articles

Cited by

References

    1. Furu M, Kajita Y, Nagayama S, Ishibe T, Shima Y, et al. (2011) Identification of AFAP1L1 as a prognostic marker for spindle cell sarcomas. Oncogene 30: 4015–4025. - PubMed
    1. Kawai A, Naito N, Yoshida A, Morimoto Y, Ouchida M, et al. (2004) Establishment and characterization of a biphasic synovial sarcoma cell line, SYO-1. Cancer Lett 204: 105–113. - PubMed
    1. Kato T Jr, Gotoh Y, Hoffmann A, Ono Y (2008) Negative regulation of constitutive NF-κB and JNK signaling by PKN1–mediated phosphorylation of TRAF1: Genes to Cells. 13: 509–520. - PubMed
    1. Kohno Y, Okaκmoto T, Ishibe T, Nagayama S, Shima Y, et al. (2006) Expression of claudin7 is tightly associated with epithelial structures in synovial sarcomas and regulated by an Ets family transcription factor, ELF3. J Biol Chem 281: 38941–38950. - PubMed
    1. Sapetschnig A, Koch F, Rischitor G, Mennenga T, Suske G (2004) Complexity of translationally controlled transcription factor Sp3 isoform expression. J Biol Chem 279: 42095–42105. - PubMed

Publication types

MeSH terms