

Prolonged induction activates Cebpα independent adipogenesis in NIH/3T3 cells
- PMID: 23326314
- PMCID: PMC3542373
- DOI: 10.1371/journal.pone.0051459
Prolonged induction activates Cebpα independent adipogenesis in NIH/3T3 cells
Abstract
Background: 3T3-L1 cells are widely used to study adipogenesis and insulin response. Their adipogenic potential decreases with time in the culture. Expressing exogenous genes in 3T3-L1 cells can be challenging. This work tries to establish and characterize an alternative model of cultured adipocytes that is easier to work with than the 3T3-L1 cells.
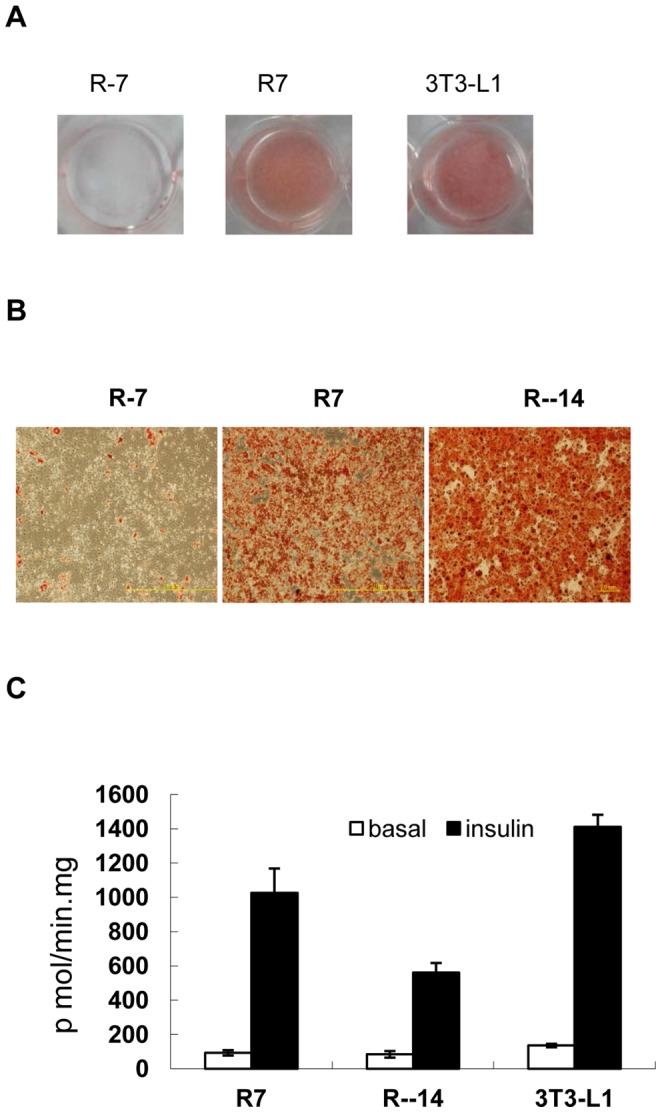
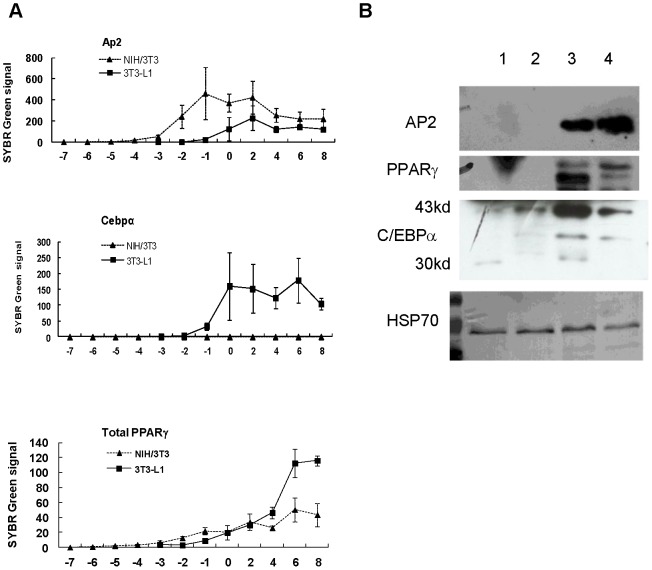
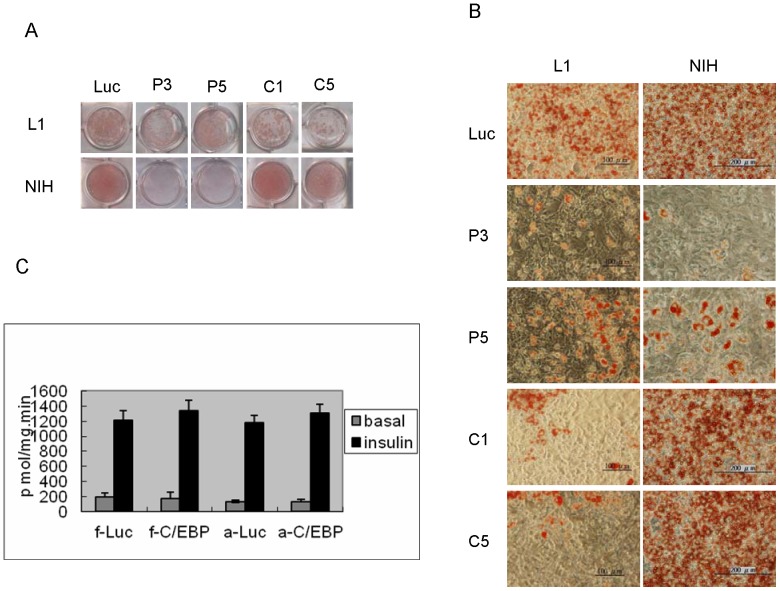
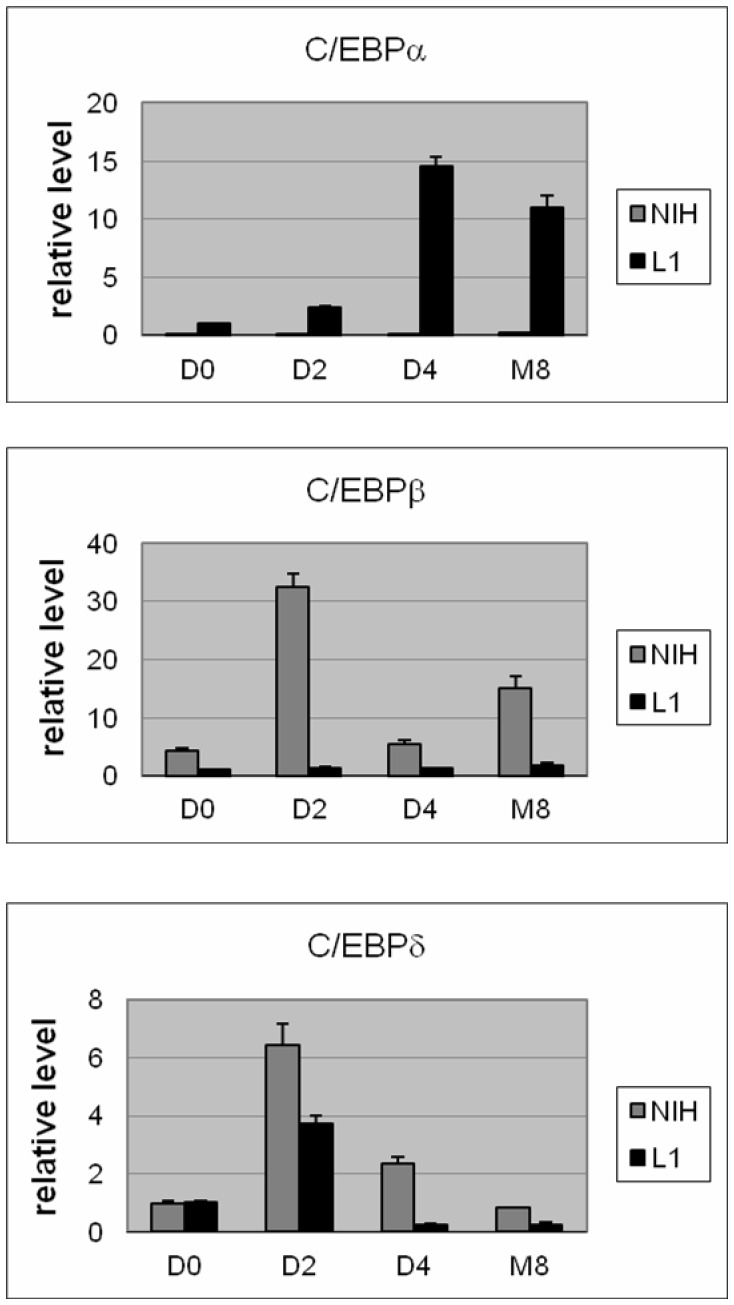
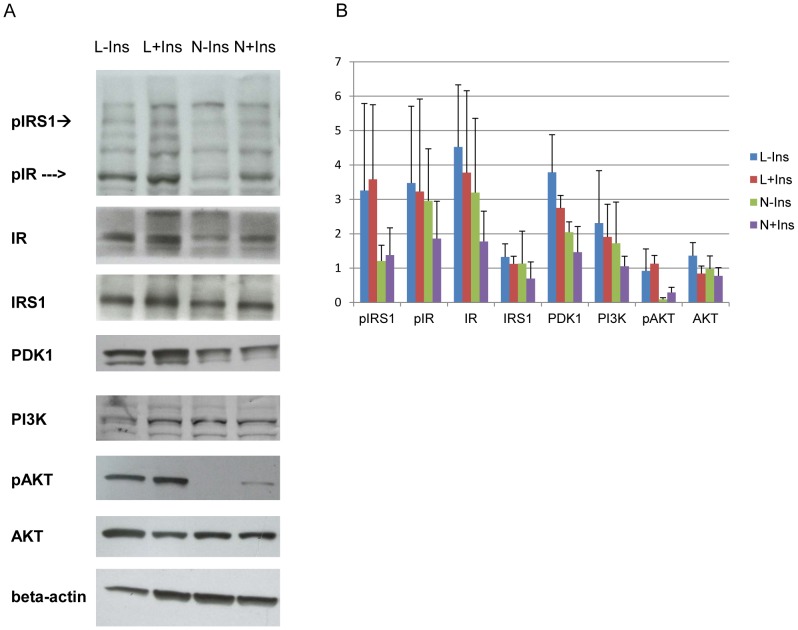
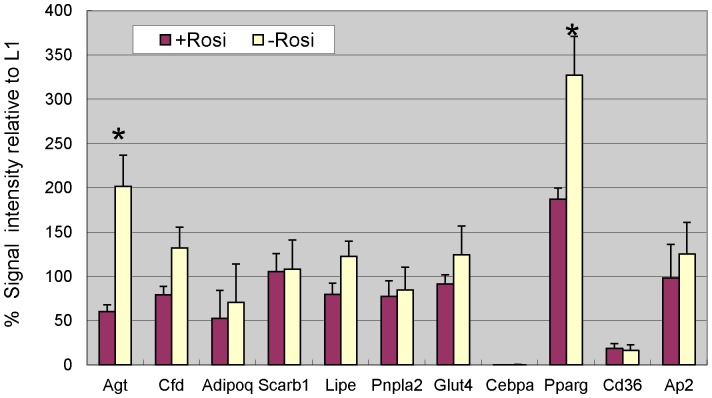
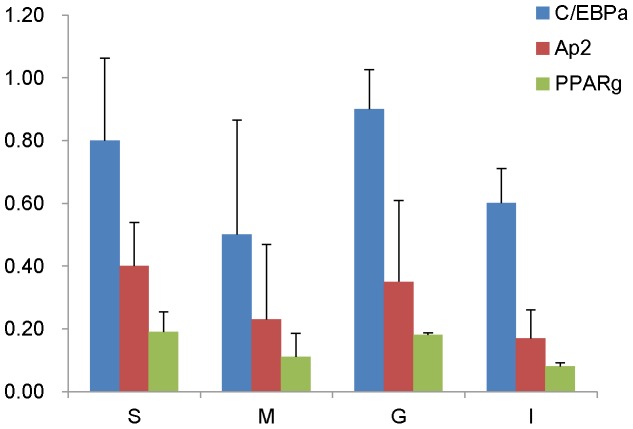
Methodology/principal findings: INDUCED CELLS WERE IDENTIFIED AS ADIPOCYTES BASED ON THE FOLLOWING THREE CHARACTERISTICS: (1) Accumulation of triglyceride droplets as demonstrated by oil red O stain. (2) Transport rate of 2-deoxyglucose increased after insulin stimulation. (3) Expression of fat specific genes such as Fabp4 (aP2), Slc2a4 (Glut4) and Pparg (PPARγ). Among the cell lines induced under different conditions in this study, only NIH/3T3 cells differentiated into adipocytes after prolonged incubation in 3T3-L1 induction medium containing 20% instead of 10% fetal bovine serum. Rosiglitazone added to the induction medium shortened the incubation period from 14 to 7 days. The PI3K/AKT pathway showed similar changes upon insulin stimulation in these two adipocytes. C/EBPα mRNA was barely detectable in NIH/3T3 adipocytes. NIH/3T3 adipocytes induced in the presence of rosiglitazone showed higher 2-deoxyglucose transport rate after insulin stimulation, expressed less Agt (angiotensinogen) and more PPARγ. Knockdown of C/EBPα using shRNA blocked 3T3-L1 but not NIH/3T3 cell differentiation. Mouse adipose tissues from various anatomical locations showed comparable levels of C/EBPα mRNA.
Conclusions/significance: NIH/3T3 cells were capable of differentiating into adipocytes without genetic engineering. They were an adipocyte model that did not require the reciprocal activation between C/EBPα and PPARγ to differentiate. Future studies in the C/EBPα independent pathways leading to insulin responsiveness may reveal new targets to diabetes treatment.
Conflict of interest statement
Figures
Similar articles
-
6-gingerol inhibits rosiglitazone-induced adipogenesis in 3T3-L1 adipocytes.Phytother Res. 2014 Feb;28(2):187-92. doi: 10.1002/ptr.4976. Epub 2013 Mar 21. Phytother Res. 2014. PMID: 23519881
-
Centipede grass exerts anti-adipogenic activity through inhibition of C/EBPβ, C/EBPα, and PPARγ expression and the AKT signaling pathway in 3T3-L1 adipocytes.BMC Complement Altern Med. 2012 Nov 26;12:230. doi: 10.1186/1472-6882-12-230. BMC Complement Altern Med. 2012. PMID: 23181522 Free PMC article.
-
α, β-Amyrin, a pentacyclic triterpenoid from Protium heptaphyllum suppresses adipocyte differentiation accompanied by down regulation of PPARγ and C/EBPα in 3T3-L1 cells.Biomed Pharmacother. 2019 Jan;109:1860-1866. doi: 10.1016/j.biopha.2018.11.027. Epub 2018 Nov 26. Biomed Pharmacother. 2019. PMID: 30551441
-
Blueberry peel extracts inhibit adipogenesis in 3T3-L1 cells and reduce high-fat diet-induced obesity.PLoS One. 2013 Jul 25;8(7):e69925. doi: 10.1371/journal.pone.0069925. Print 2013. PLoS One. 2013. PMID: 23936120 Free PMC article.
-
Insulin interacts with PPARγ agonists to promote bovine adipocyte differentiation.Domest Anim Endocrinol. 2024 Jul;88:106848. doi: 10.1016/j.domaniend.2024.106848. Epub 2024 Mar 29. Domest Anim Endocrinol. 2024. PMID: 38574690 Review.
Cited by
-
Osmanthus fragrans Flavonoid Extract Inhibits Adipogenesis and Induces Beiging in 3T3-L1 Adipocytes.Foods. 2024 Jun 16;13(12):1894. doi: 10.3390/foods13121894. Foods. 2024. PMID: 38928836 Free PMC article.
-
Stable and reproducible transgene expression independent of proliferative or differentiated state using BAC TG-EMBED.Gene Ther. 2018 Aug;25(5):376-391. doi: 10.1038/s41434-018-0021-z. Epub 2018 Jun 21. Gene Ther. 2018. PMID: 29930343 Free PMC article.
-
Lotus (Nelumbo nucifera Gaertn.) Leaf-Fermentation Supernatant Inhibits Adipogenesis in 3T3-L1 Preadipocytes and Suppresses Obesity in High-Fat Diet-Induced Obese Rats.Nutrients. 2022 Oct 17;14(20):4348. doi: 10.3390/nu14204348. Nutrients. 2022. PMID: 36297031 Free PMC article.
-
N-Acetylcysteine affects obesity-related protein expression in 3T3-L1 adipocytes.Redox Rep. 2013;18(6):210-8. doi: 10.1179/1351000213Y.0000000066. Redox Rep. 2013. PMID: 24112955 Free PMC article.
-
Bilobalide Suppresses Adipogenesis in 3T3-L1 Adipocytes via the AMPK Signaling Pathway.Molecules. 2019 Sep 27;24(19):3503. doi: 10.3390/molecules24193503. Molecules. 2019. PMID: 31569605 Free PMC article.
References
-
- Rosen ED, MacDougald OA (2006) Adipocyte differentiation from the inside out. Nat Rev Mol Cell Biol 7: 885–896. - PubMed
-
- Green H, Kehinde O (1975) An established preadipose cell line and its differentiation in culture. II. Factors affecting the adipose conversion. Cell 5: 19–27. - PubMed
-
- Green H, Meuth M (1974) An established pre-adipose cell line and its differentiation in culture. Cell 3: 127–133. - PubMed
-
- Rubin CS, Hirsch A, Fung C, Rosen OM (1978) Development of hormone receptors and hormonal responsiveness in vitro. Insulin receptors and insulin sensitivity in the preadipocyte and adipocyte forms of 3T3-L1 cells. J Biol Chem 253: 7570–7578. - PubMed
Publication types
MeSH terms
Substances
LinkOut - more resources
Full Text Sources
Other Literature Sources
Research Materials
Miscellaneous
