

Crop expansion and conservation priorities in tropical countries
- PMID: 23326316
- PMCID: PMC3541398
- DOI: 10.1371/journal.pone.0051759
Crop expansion and conservation priorities in tropical countries
Abstract
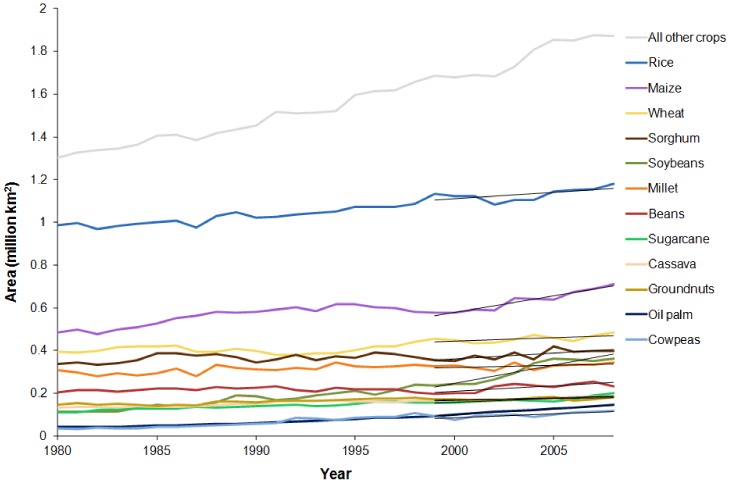
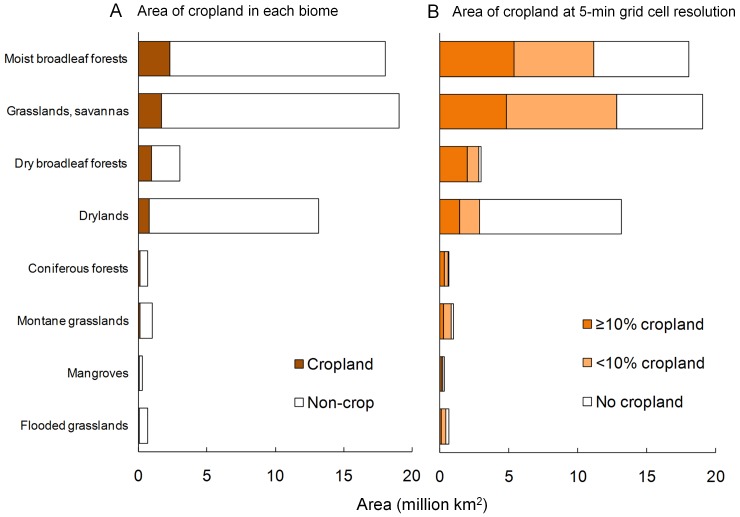
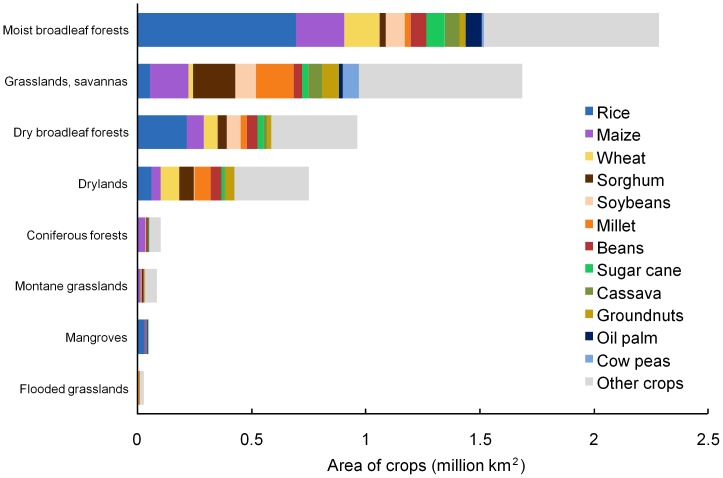
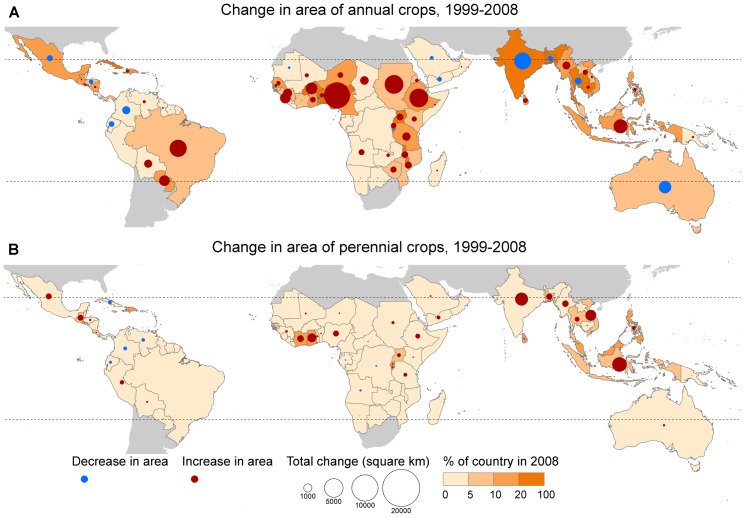
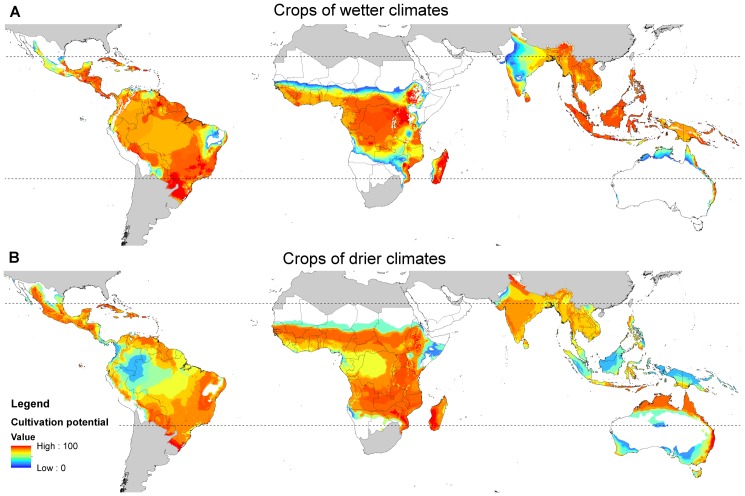
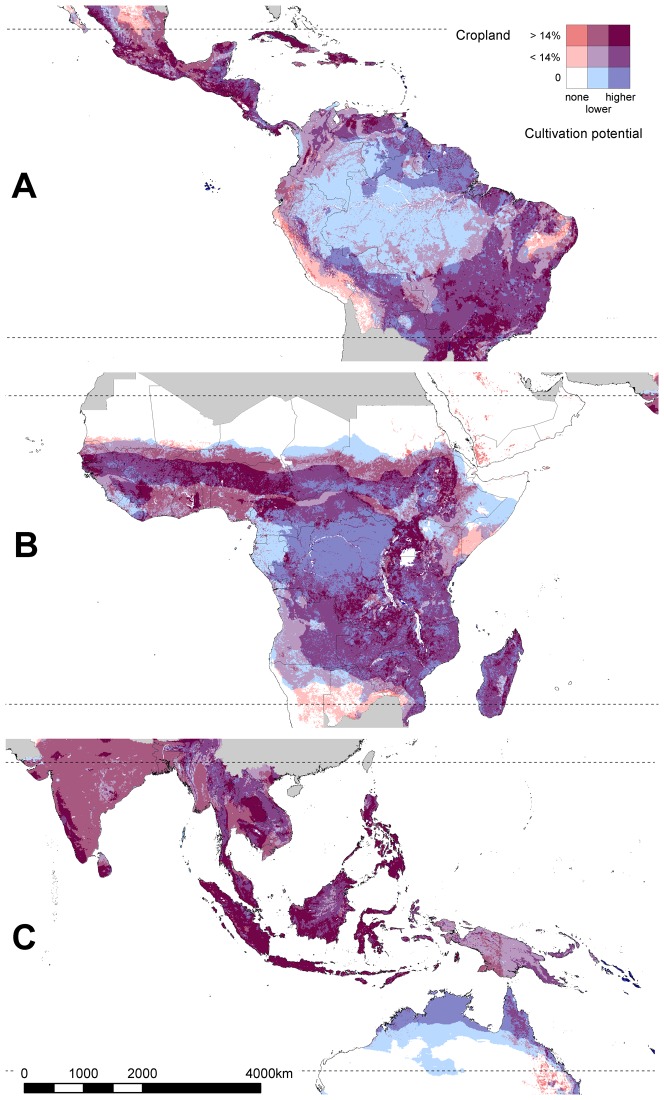
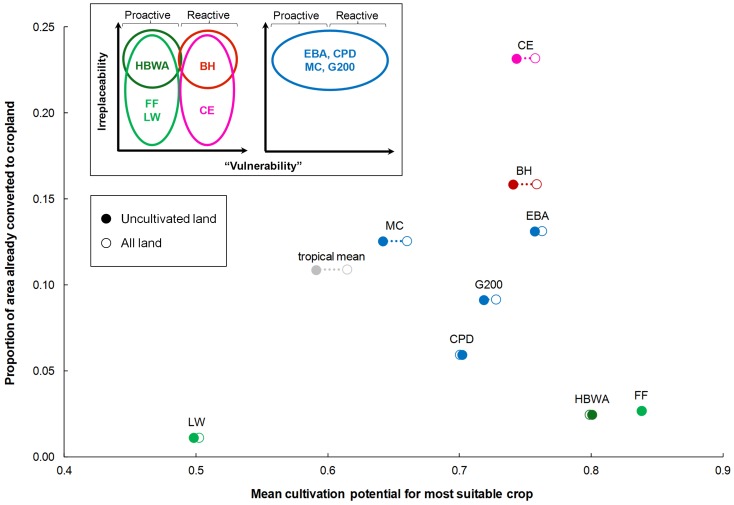
Expansion of cropland in tropical countries is one of the principal causes of biodiversity loss, and threatens to undermine progress towards meeting the Aichi Biodiversity Targets. To understand this threat better, we analysed data on crop distribution and expansion in 128 tropical countries, assessed changes in area of the main crops and mapped overlaps between conservation priorities and cultivation potential. Rice was the single crop grown over the largest area, especially in tropical forest biomes. Cropland in tropical countries expanded by c. 48,000 km(2) per year from 1999-2008. The countries which added the greatest area of new cropland were Nigeria, Indonesia, Ethiopia, Sudan and Brazil. Soybeans and maize are the crops which expanded most in absolute area. Other crops with large increases included rice, sorghum, oil palm, beans, sugar cane, cow peas, wheat and cassava. Areas of high cultivation potential-while bearing in mind that political and socio-economic conditions can be as influential as biophysical ones-may be vulnerable to conversion in the future. These include some priority areas for biodiversity conservation in tropical countries (e.g., Frontier Forests and High Biodiversity Wilderness Areas), which have previously been identified as having 'low vulnerability', in particular in central Africa and northern Australia. There are also many other smaller areas which are important for biodiversity and which have high cultivation potential (e.g., in the fringes of the Amazon basin, in the Paraguayan Chaco, and in the savanna woodlands of the Sahel and East Africa). We highlight the urgent need for more effective sustainability standards and policies addressing both production and consumption of tropical commodities, including robust land-use planning in agricultural frontiers, establishment of new protected areas or REDD+ projects in places agriculture has not yet reached, and reduction or elimination of incentives for land-demanding bioenergy feedstocks.
Conflict of interest statement
Figures
Similar articles
-
Agricultural expansion and its impacts on tropical nature.Trends Ecol Evol. 2014 Feb;29(2):107-16. doi: 10.1016/j.tree.2013.12.001. Epub 2013 Dec 30. Trends Ecol Evol. 2014. PMID: 24388286 Review.
-
Dramatic cropland expansion in Myanmar following political reforms threatens biodiversity.Sci Rep. 2018 Nov 8;8(1):16558. doi: 10.1038/s41598-018-34974-8. Sci Rep. 2018. PMID: 30409993 Free PMC article.
-
Land-use planning in the Chaco plain (Burruyacú, Argentina). Part 1: evaluating land-use options to support crop diversification in an agricultural frontier area using physical land evaluation.Environ Manage. 2008 Dec;42(6):1043-63. doi: 10.1007/s00267-008-9208-1. Epub 2008 Oct 11. Environ Manage. 2008. PMID: 18850245
-
Combining high biodiversity with high yields in tropical agroforests.Proc Natl Acad Sci U S A. 2011 May 17;108(20):8311-6. doi: 10.1073/pnas.1016799108. Epub 2011 May 2. Proc Natl Acad Sci U S A. 2011. PMID: 21536873 Free PMC article.
-
The environmental impacts of palm oil in context.Nat Plants. 2020 Dec;6(12):1418-1426. doi: 10.1038/s41477-020-00813-w. Epub 2020 Dec 7. Nat Plants. 2020. PMID: 33299148 Review.
Cited by
-
Tree cover in Central Africa: determinants and sensitivity under contrasted scenarios of global change.Sci Rep. 2017 Jan 30;7:41393. doi: 10.1038/srep41393. Sci Rep. 2017. PMID: 28134259 Free PMC article.
-
Can Anaerobic Soil Disinfestation (ASD) be a Game Changer in Tropical Agriculture?Pathogens. 2021 Jan 28;10(2):133. doi: 10.3390/pathogens10020133. Pathogens. 2021. PMID: 33525615 Free PMC article. Review.
-
Improving Human Diets and Welfare through Using Herbivore-Based Foods: 2. Environmental Consequences and Mitigations.Animals (Basel). 2024 Apr 30;14(9):1353. doi: 10.3390/ani14091353. Animals (Basel). 2024. PMID: 38731357 Free PMC article. Review.
-
Benefits and costs of oil palm expansion in Central Kalimantan, Indonesia, under different policy scenarios.Reg Environ Change. 2016;16:1011-1021. doi: 10.1007/s10113-015-0815-0. Epub 2015 May 28. Reg Environ Change. 2016. PMID: 27429582 Free PMC article.
-
Exploring agricultural land-use and childhood malaria associations in sub-Saharan Africa.Sci Rep. 2022 Mar 8;12(1):4124. doi: 10.1038/s41598-022-07837-6. Sci Rep. 2022. PMID: 35260722 Free PMC article.
References
-
- Tilman D, Fargione J, Wolff B, D'Antonio C, Dobson A, et al. (2001) Forecasting agriculturally driven global environmental change. Science 292: 281–284. - PubMed
-
- Foley JA, DeFries R, Asner GP, Barford C, Bonan G, et al. (2005) Global consequences of land use. Science 309: 570–574. - PubMed
-
- Ellis EC, Ramankutty N (2008) Putting people in the map: anthropogenic biomes of the world. Front Ecol Environ 6: 439–447.
-
- Ramankutty N, Evan AT, Monfreda C, Foley JA (2008) Farming the planet: 1. Geographic distribution of global agricultural lands in the year 2000. Global Biogeochem Cycles 22: GB1003 doi:10.1029/2007GB002952. - DOI
Publication types
MeSH terms
LinkOut - more resources
Full Text Sources
Other Literature Sources
