

Behavioral responses to epidemics in an online experiment: using virtual diseases to study human behavior
- PMID: 23326360
- PMCID: PMC3541346
- DOI: 10.1371/journal.pone.0052814
Behavioral responses to epidemics in an online experiment: using virtual diseases to study human behavior
Abstract
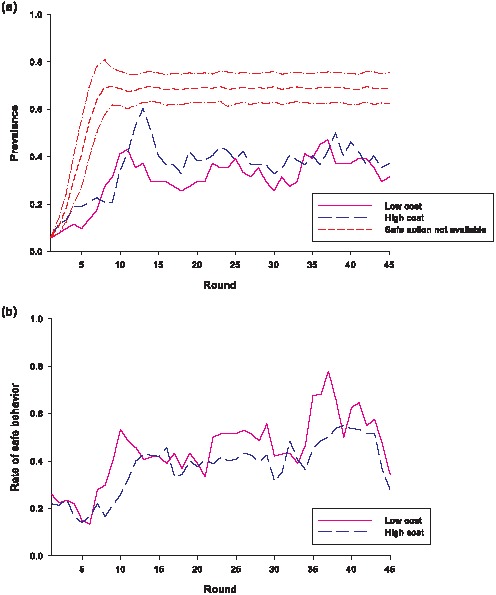
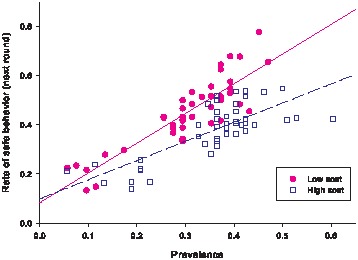
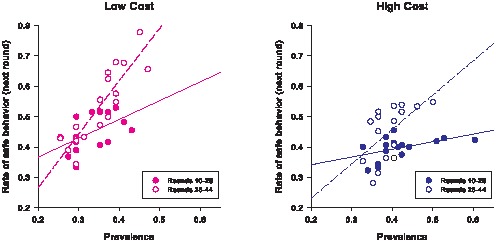
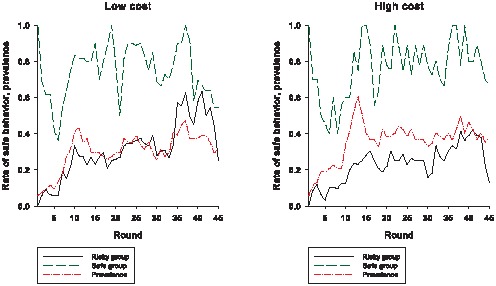
We report the results of a study we conducted using a simple multiplayer online game that simulates the spread of an infectious disease through a population composed of the players. We use our virtual epidemics game to examine how people respond to epidemics. The analysis shows that people's behavior is responsive to the cost of self-protection, the reported prevalence of disease, and their experiences earlier in the epidemic. Specifically, decreasing the cost of self-protection increases the rate of safe behavior. Higher reported prevalence also raises the likelihood that individuals would engage in self-protection, where the magnitude of this effect depends on how much time has elapsed in the epidemic. Individuals' experiences in terms of how often an infection was acquired when they did not engage in self-protection are another factor that determines whether they will invest in preventive measures later on. All else being equal, individuals who were infected at a higher rate are more likely to engage in self-protective behavior compared to those with a lower rate of infection. Lastly, fixing everything else, people's willingness to engage in safe behavior waxes or wanes over time, depending on the severity of an epidemic: when prevalence is high, people are more likely to adopt self-protective measures as time goes by; when prevalence is low, a 'self-protection fatigue' effect sets in whereby individuals are less willing to engage in safe behavior over time.
Conflict of interest statement
Figures
References
-
- World Health Organization (2007) The world health report 2007: a safer future: global public health security in the 21st century. Geneva: WHO. 72 p.
-
- UNAIDS (2010) Global report: UNAIDS report on the global AIDS epidemic 2010. Geneva: WHO. 359 p.
-
- WHO (2011) Global tuberculosis control: WHO report 2011. Geneva: WHO. 246 p.
-
- UNAIDS (2001) HIV prevention needs and successes: a tale of three countries. Geneva: UNAIDS. 19 p.
-
- Stoneburner R, Low-Beer D (2004) Population-level HIV declines and behavioral risk avoidance in Uganda. Science 304: 714–718. - PubMed
Publication types
MeSH terms
LinkOut - more resources
Full Text Sources
Other Literature Sources
Medical
