

The use of census migration data to approximate human movement patterns across temporal scales
- PMID: 23326367
- PMCID: PMC3541275
- DOI: 10.1371/journal.pone.0052971
The use of census migration data to approximate human movement patterns across temporal scales
Abstract
Human movement plays a key role in economies and development, the delivery of services, and the spread of infectious diseases. However, it remains poorly quantified partly because reliable data are often lacking, particularly for low-income countries. The most widely available are migration data from human population censuses, which provide valuable information on relatively long timescale relocations across countries, but do not capture the shorter-scale patterns, trips less than a year, that make up the bulk of human movement. Census-derived migration data may provide valuable proxies for shorter-term movements however, as substantial migration between regions can be indicative of well connected places exhibiting high levels of movement at finer time scales, but this has never been examined in detail. Here, an extensive mobile phone usage data set for Kenya was processed to extract movements between counties in 2009 on weekly, monthly, and annual time scales and compared to data on change in residence from the national census conducted during the same time period. We find that the relative ordering across Kenyan counties for incoming, outgoing and between-county movements shows strong correlations. Moreover, the distributions of trip durations from both sources of data are similar, and a spatial interaction model fit to the data reveals the relationships of different parameters over a range of movement time scales. Significant relationships between census migration data and fine temporal scale movement patterns exist, and results suggest that census data can be used to approximate certain features of movement patterns across multiple temporal scales, extending the utility of census-derived migration data.
Conflict of interest statement
Figures
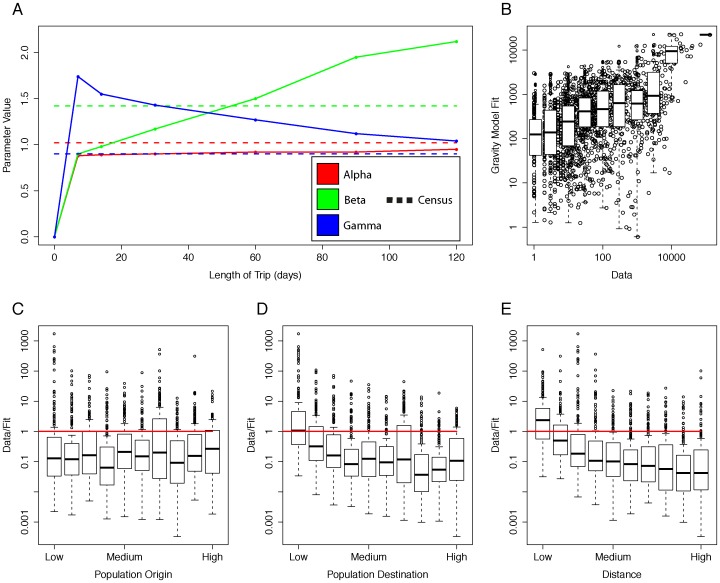
 are shown from the fit for various trip durations. Each parameter value from the census data is shown in the corresponding color as a dotted line. A gravity model was calibrated to fit the number of trips between counties lasting between 2 and 3 months. B) The actual data versus the gravity model fit is shown in the figure (Data/Fit). The ratio of true data to the results of the fitted model are shown broken down by C) population at the origin county, D) population at the destination and E) the distance (in kilometers) between the origin and destination. The model underestimates movements from low population counties (both as an origin and destination) and shorter trips.
References
-
- Viboud C, Bjornstad ON, Smith DL, Simonsen L, Miller MA, et al. (2006) Synchrony, waves, and spatial hierarchies in the spread of influenza. Science 312: 447–451. - PubMed
-
- Prothero RM (1977) Disease and mobility: a neglected factor in epidemiology. Int J Epidemiol 6: 259–287. - PubMed
-
- Ferguson NM, Cummings DA, Cauchemez S, Fraser C, Riley S, et al. (2005) Strategies for containing an emerging influenza pandemic in southeast Asia. Nature 437: 209–214. - PubMed
Publication types
MeSH terms
Grants and funding
LinkOut - more resources
Full Text Sources
Other Literature Sources
Medical
