

Endotoxin tolerance variation over 24 h during porcine endotoxemia: association with changes in circulation and organ dysfunction
- PMID: 23326400
- PMCID: PMC3542331
- DOI: 10.1371/journal.pone.0053221
Endotoxin tolerance variation over 24 h during porcine endotoxemia: association with changes in circulation and organ dysfunction
Abstract
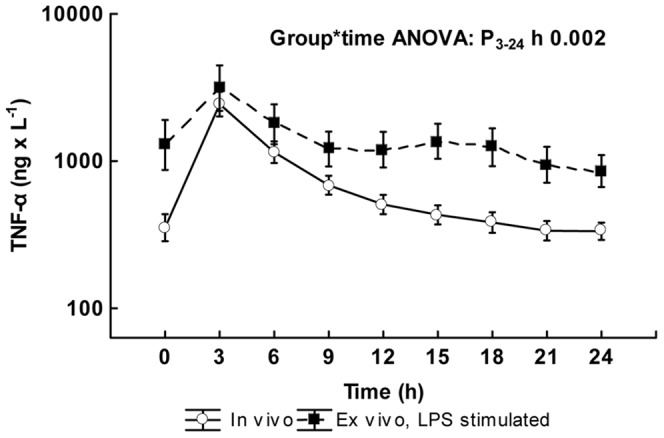
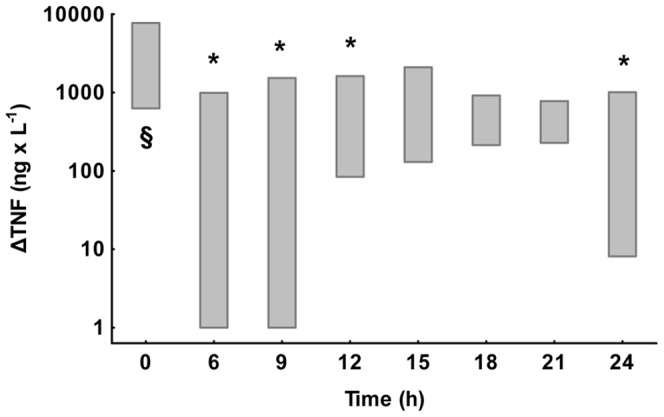
Endotoxin tolerance (ET), defined as reduced inflammatory responsiveness to endotoxin challenge following a first encounter with endotoxin, is an extensively studied phenomenon. Although reduced mortality and morbidity in the presence of ET has been demonstrated in animal studies, little is known about the temporal development of ET. Further, in acute respiratory distress syndrome ET correlates to the severity of the disease, suggesting a complicated relation between ET and organ dysfunction. Eighteen pigs were subjected to intensive care and a continuous endotoxin infusion for 24 h with the aim to study the time course of early ET and to relate ET to outcome in organ dysfunction. Three animals served as non-endotoxemic controls. Blood samples for cytokine analyses were taken and physiological variables registered every third hour. Production of TNF-α, IL-6, and IL-10 before and after endotoxin stimulation ex vivo was measured. The difference between cytokine values after and before ex vivo LPS stimulation (Δ-values) was calculated for all time points. ΔTNF-α was employed as the principal marker of ET and lower ΔTNF-α values were interpreted as higher levels of ET. During endotoxin infusion, there was suppression of ex vivo productions of TNF-α and IL-6 but not of IL-10 in comparison with that at 0 h. The ex vivo TNF-α values followed another time concentration curve than those in vivo. ΔTNF-α was at the lowest already at 6 h, followed by an increase during the ensuing hours. ΔTNF-α at 6 h correlated positively to blood pressure and systemic vascular resistance and negatively to cardiac index at 24 h. In this study a temporal variation of ET was demonstrated that did not follow changes in plasma TNF-α concentrations. Maximal ET occurred early in the course and the higher the ET, the more hyperdynamic the circulation 18 h later.
Conflict of interest statement
Figures

Similar articles
-
A non-linear mixed effect model for innate immune response: In vivo kinetics of endotoxin and its induction of the cytokines tumor necrosis factor alpha and interleukin-6.PLoS One. 2019 Feb 21;14(2):e0211981. doi: 10.1371/journal.pone.0211981. eCollection 2019. PLoS One. 2019. PMID: 30789941 Free PMC article.
-
Endotoxemia and endotoxin tolerance in patients with ARDS.Langenbecks Arch Surg. 2008 Jul;393(4):473-8. doi: 10.1007/s00423-008-0317-3. Epub 2008 Mar 5. Langenbecks Arch Surg. 2008. PMID: 18320210
-
Induction of early-phase endotoxin tolerance in horses.Equine Vet J. 1996 Jul;28(4):269-74. doi: 10.1111/j.2042-3306.1996.tb03090.x. Equine Vet J. 1996. PMID: 8818592
-
Effect of major abdominal surgery on endotoxin release and expression of Toll-like receptors 2/4.Langenbecks Arch Surg. 2009 Mar;394(2):293-302. doi: 10.1007/s00423-008-0357-8. Epub 2008 Jun 11. Langenbecks Arch Surg. 2009. PMID: 18546014
-
Plasma interleukin-6 levels in patients with cirrhosis. Relationship to endotoxemia, tumor necrosis factor-alpha, and hyperdynamic circulation.Scand J Gastroenterol. 1996 May;31(5):500-5. doi: 10.3109/00365529609006772. Scand J Gastroenterol. 1996. PMID: 8734349
Cited by
-
Acute systemic inflammatory response to lipopolysaccharide stimulation in pigs divergently selected for residual feed intake.BMC Genomics. 2019 Oct 11;20(1):728. doi: 10.1186/s12864-019-6127-x. BMC Genomics. 2019. PMID: 31610780 Free PMC article.
-
The antisecretory peptide AF-16 may modulate tissue edema but not inflammation in experimental peritonitis induced sepsis.PLoS One. 2020 Aug 21;15(8):e0232302. doi: 10.1371/journal.pone.0232302. eCollection 2020. PLoS One. 2020. PMID: 32822373 Free PMC article.
-
Compartment-Specific Differences in the Activation of Monocyte Subpopulations Are Not Affected by Nitric Oxide and Glucocorticoid Treatment in a Model of Resuscitated Porcine Endotoxemic Shock.J Clin Med. 2022 May 8;11(9):2641. doi: 10.3390/jcm11092641. J Clin Med. 2022. PMID: 35566768 Free PMC article.
-
The Development of a Juvenile Porcine Augmented Renal Clearance Model Through Continuous Infusion of Lipopolysaccharides: An Exploratory Study.Front Vet Sci. 2021 Apr 29;8:639771. doi: 10.3389/fvets.2021.639771. eCollection 2021. Front Vet Sci. 2021. PMID: 33996970 Free PMC article.
-
Beneficial antimicrobial effect of the addition of an aminoglycoside to a β-lactam antibiotic in an E. coli porcine intensive care severe sepsis model.PLoS One. 2014 Feb 28;9(2):e90441. doi: 10.1371/journal.pone.0090441. eCollection 2014. PLoS One. 2014. PMID: 24587365 Free PMC article.
References
-
- Alexander C, Rietschel ET (2001) Bacterial lipopolysaccharides and innate immunity. J Endotoxin Res 7: 167–202. - PubMed
-
- West MA, Heagy W (2002) Endotoxin tolerance: a review. Crit Care Med 30: S64–73. - PubMed
-
- Cavaillon J-M, Adib-Conquy M (2006) Bench-to-bedside review: endotoxin tolerance as a model of leukocyte reprogramming in sepsis. Crit Care 10: 233 doi:10.1186/cc5055. - DOI - PMC - PubMed
-
- Biswas SK, Lopez-Collazo E (2009) Endotoxin tolerance: new mechanisms, molecules and clinical significance. Trends Immunol 30: 475–487 doi:10.1016/j.it.2009.07.009. - DOI - PubMed
Publication types
MeSH terms
Substances
LinkOut - more resources
Full Text Sources
Other Literature Sources
