

Window area and development drive spatial variation in bird-window collisions in an urban landscape
- PMID: 23326420
- PMCID: PMC3541239
- DOI: 10.1371/journal.pone.0053371
Window area and development drive spatial variation in bird-window collisions in an urban landscape
Abstract
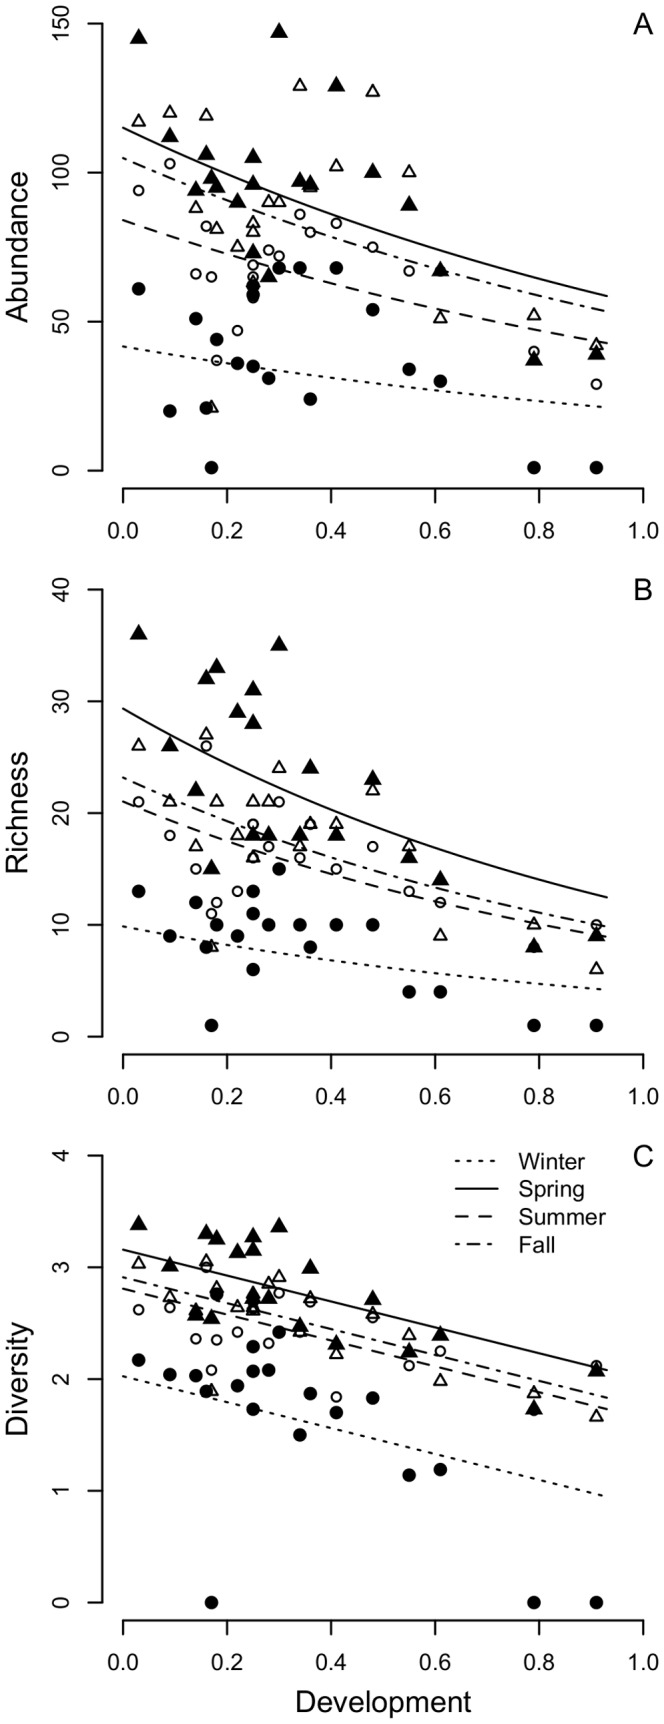
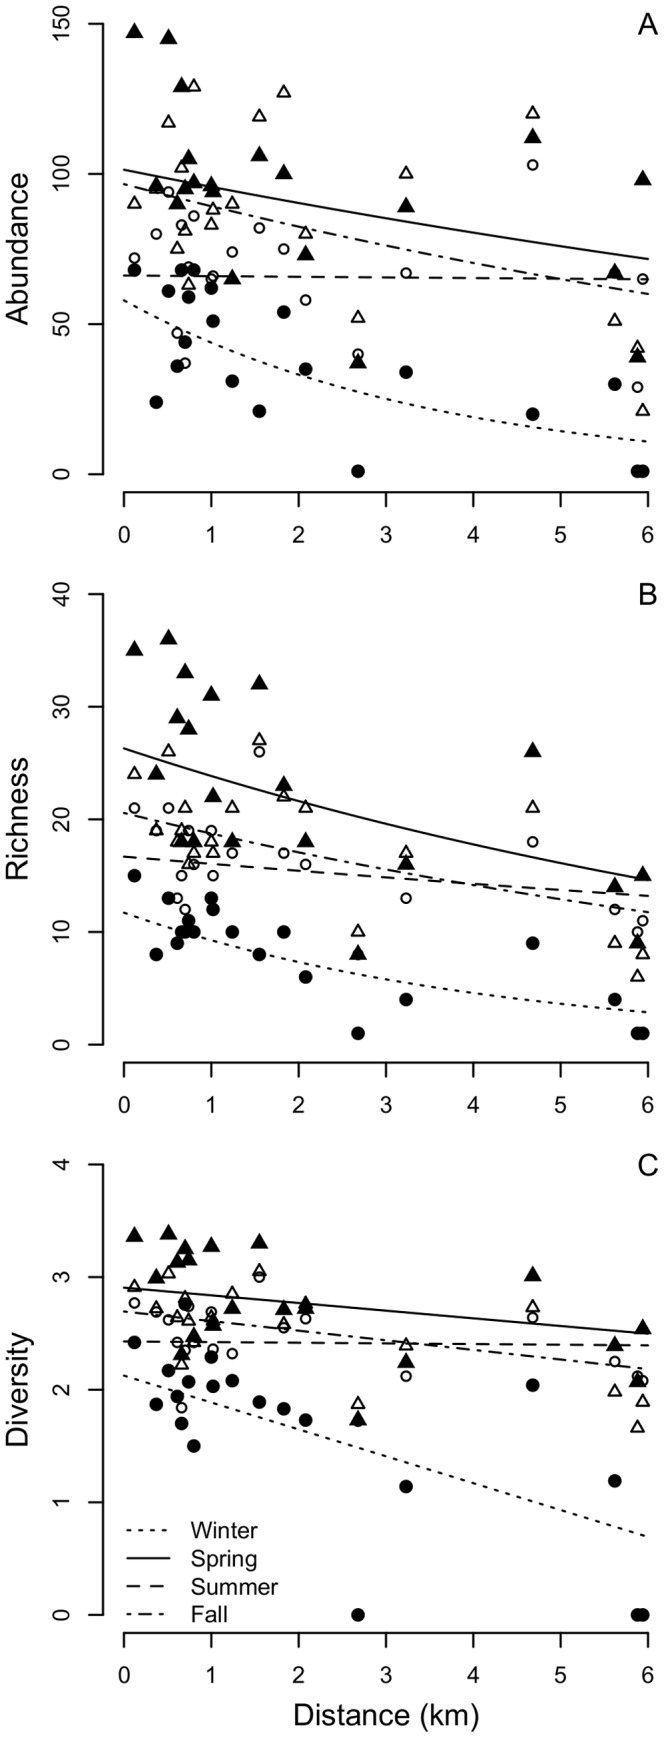
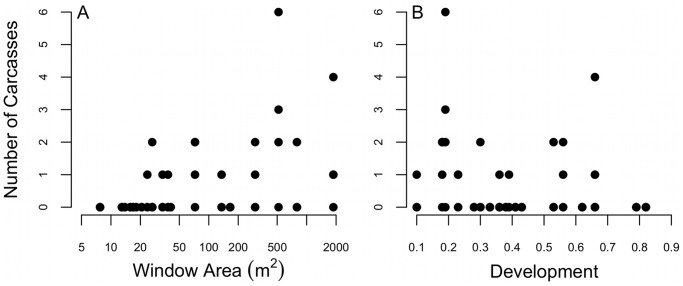
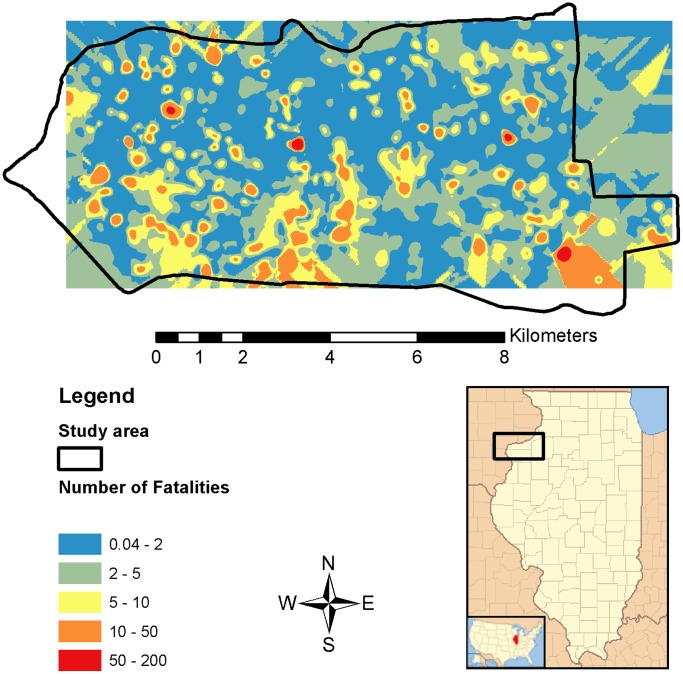
Collisions with windows are an important human-related threat to birds in urban landscapes. However, the proximate drivers of collisions are not well understood, and no study has examined spatial variation in mortality in an urban setting. We hypothesized that the number of fatalities at buildings varies with window area and habitat features that influence avian community structure. In 2010 we documented bird-window collisions (BWCs) and characterized avian community structure at 20 buildings in an urban landscape in northwestern Illinois, USA. For each building and season, we conducted 21 daily surveys for carcasses and nine point count surveys to estimate relative abundance, richness, and diversity. Our sampling design was informed by experimentally estimated carcass persistence times and detection probabilities. We used linear and generalized linear mixed models to evaluate how habitat features influenced community structure and how mortality was affected by window area and factors that correlated with community structure. The most-supported model was consistent for all community indices and included effects of season, development, and distance to vegetated lots. BWCs were related positively to window area and negatively to development. We documented mortalities for 16/72 (22%) species (34 total carcasses) recorded at buildings, and BWCs were greater for juveniles than adults. Based on the most-supported model of BWCs, the median number of annual predicted fatalities at study buildings was 3 (range = 0-52). These results suggest that patchily distributed environmental resources and levels of window area in buildings create spatial variation in BWCs within and among urban areas. Current mortality estimates place little emphasis on spatial variation, which precludes a fundamental understanding of the issue. To focus conservation efforts, we illustrate how knowledge of the structural and environmental factors that influence bird-window collisions can be used to predict fatalities in the broader landscape.
Conflict of interest statement
Figures
Similar articles
-
Bird-window collisions in the summer breeding season.PeerJ. 2014 Jun 26;2:e460. doi: 10.7717/peerj.460. eCollection 2014. PeerJ. 2014. PMID: 25024923 Free PMC article.
-
Bird-Window Collisions at a West-Coast Urban Park Museum: Analyses of Bird Biology and Window Attributes from Golden Gate Park, San Francisco.PLoS One. 2016 Jan 5;11(1):e0144600. doi: 10.1371/journal.pone.0144600. eCollection 2016. PLoS One. 2016. PMID: 26731417 Free PMC article.
-
Factors influencing experimental estimation of scavenger removal and observer detection in bird-window collision surveys.Ecol Appl. 2018 Dec;28(8):2119-2129. doi: 10.1002/eap.1800. Epub 2018 Oct 1. Ecol Appl. 2018. PMID: 30194798
-
Non-linearities in bird responses across urbanization gradients: A meta-analysis.Glob Chang Biol. 2018 Mar;24(3):1046-1054. doi: 10.1111/gcb.13964. Epub 2017 Nov 23. Glob Chang Biol. 2018. PMID: 29080260
-
Main causes of bird-window collisions: a review.An Acad Bras Cienc. 2020 Mar 16;92(1):e20180745. doi: 10.1590/0001-3765202020180745. eCollection 2020. An Acad Bras Cienc. 2020. PMID: 32187254 Review.
Cited by
-
Ultraviolet-reflective film applied to windows reduces the likelihood of collisions for two species of songbird.PeerJ. 2020 Sep 16;8:e9926. doi: 10.7717/peerj.9926. eCollection 2020. PeerJ. 2020. PMID: 32995088 Free PMC article.
-
Winter bird-window collisions: mitigation success, risk factors, and implementation challenges.PeerJ. 2019 Sep 2;7:e7620. doi: 10.7717/peerj.7620. eCollection 2019. PeerJ. 2019. PMID: 31534854 Free PMC article.
-
Bird protection treatments reduce bird-window collision risk at low-rise buildings within a Pacific coastal protected area.PeerJ. 2022 Mar 22;10:e13142. doi: 10.7717/peerj.13142. eCollection 2022. PeerJ. 2022. PMID: 35341053 Free PMC article.
-
Geo-referencing bird-window collisions for targeted mitigation.PeerJ. 2018 Jan 4;6:e4215. doi: 10.7717/peerj.4215. eCollection 2018. PeerJ. 2018. PMID: 29312833 Free PMC article.
-
Rehabilitation outcomes of bird-building collision victims in the Northeastern United States.PLoS One. 2024 Aug 7;19(8):e0306362. doi: 10.1371/journal.pone.0306362. eCollection 2024. PLoS One. 2024. PMID: 39110767 Free PMC article.
References
-
- Blair RB (2001) Creating a homogeneous avifauna. In: Marzluff JM, Bowman R, Donnelly RE, editors. Avian ecology and conservation in an urbanizing world. Norwell, Massachusetts: Kluwer Academic. 459–486.
-
- Chace JF, Walsh JJ (2006) Urban effects on native avifauna: a review. Landsc Urban Plan 74: 46–69.
-
- Shochat E, Lerman S, Fernández-Juricic E (2010) Birds in urban ecosystems: population dynamics, community structure, biodiversity, and conservation. In: Aitkenhead-Peterson J, Volder A, editors. Urban ecosystem ecology, agronomy monograph 55. Madison: ASA-CSSA-SSSA. 75–86.
-
- Drewitt AL, Langston RHW (2008) Collision effects of wind-power generators and other obstacles on birds. Ann N Y Acad Sci 1134: 233–266. - PubMed
-
- Klem D Jr (1989) Bird-window collisions. Wilson Bull 101: 606–620.
Publication types
MeSH terms
LinkOut - more resources
Full Text Sources
Other Literature Sources
