. 2013;8(1):e53457.
doi: 10.1371/journal.pone.0053457. Epub 2013 Jan 11.

Immediate and heterogeneous response of the LiaFSR two-component system of Bacillus subtilis to the peptide antibiotic bacitracin

Affiliations

Immediate and heterogeneous response of the LiaFSR two-component system of Bacillus subtilis to the peptide antibiotic bacitracin

Sara Kesel et al. PLoS One. 2013.

Abstract

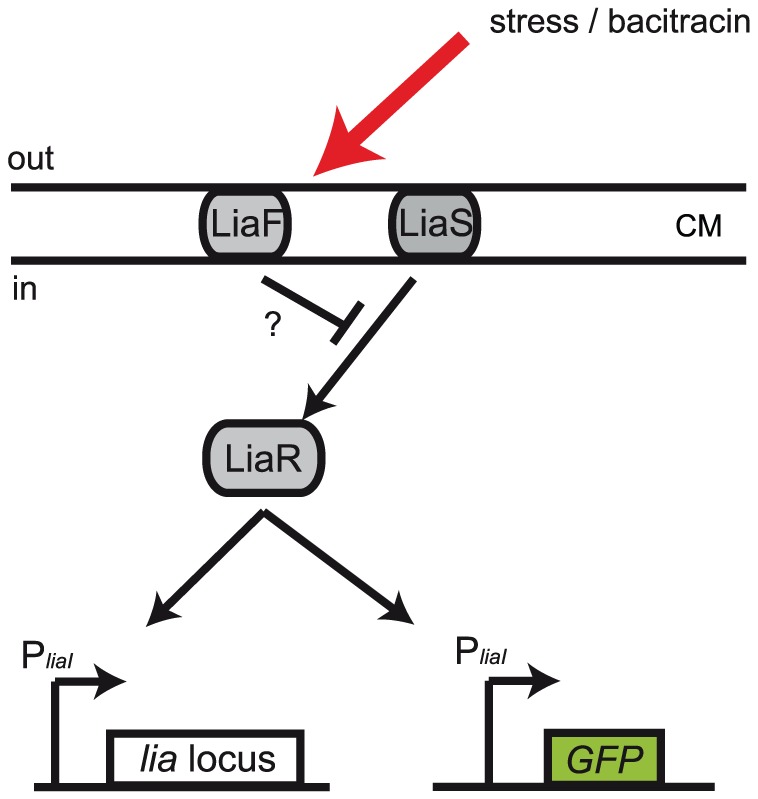
Background: Two-component signal transduction systems are one means of bacteria to respond to external stimuli. The LiaFSR two-component system of Bacillus subtilis consists of a regular two-component system LiaRS comprising the core Histidine Kinase (HK) LiaS and the Response Regulator (RR) LiaR and additionally the accessory protein LiaF, which acts as a negative regulator of LiaRS-dependent signal transduction. The complete LiaFSR system was shown to respond to various peptide antibiotics interfering with cell wall biosynthesis, including bacitracin.

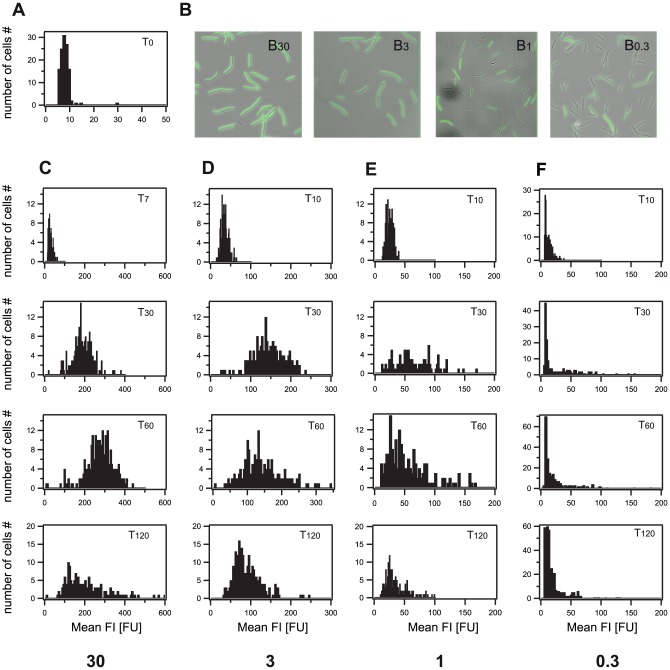
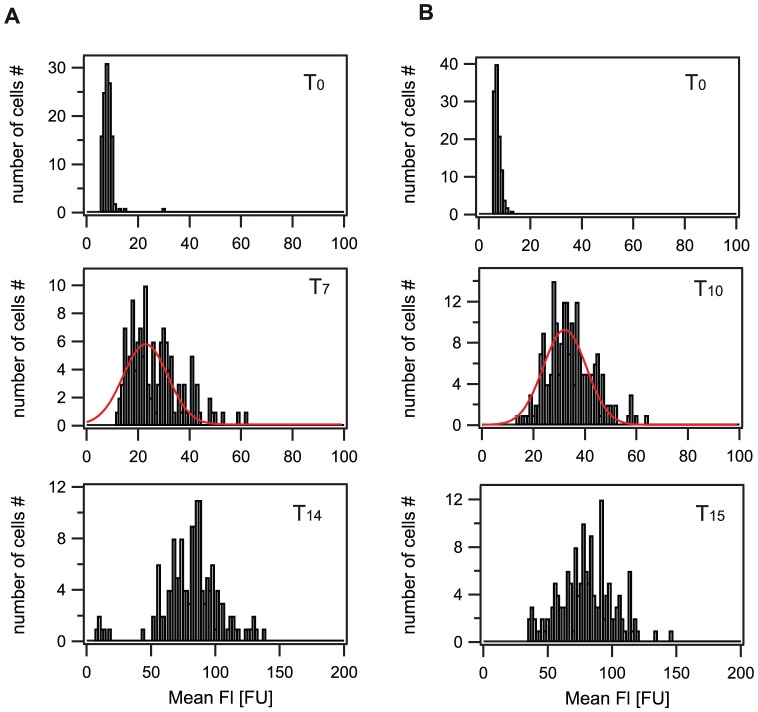
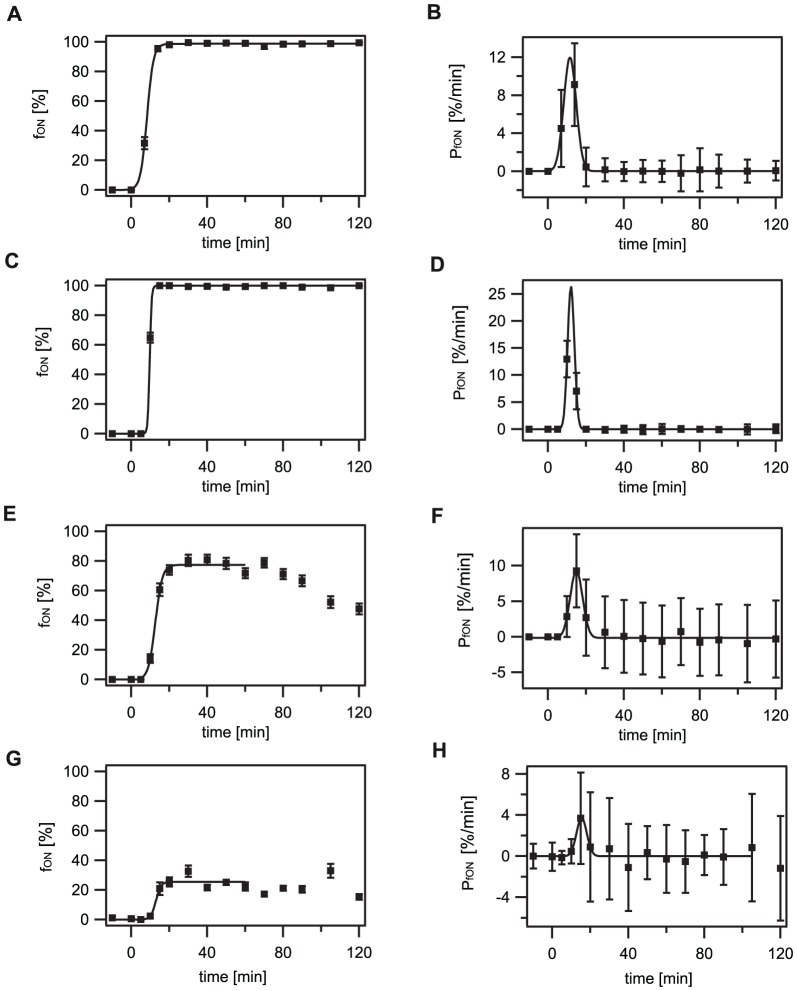
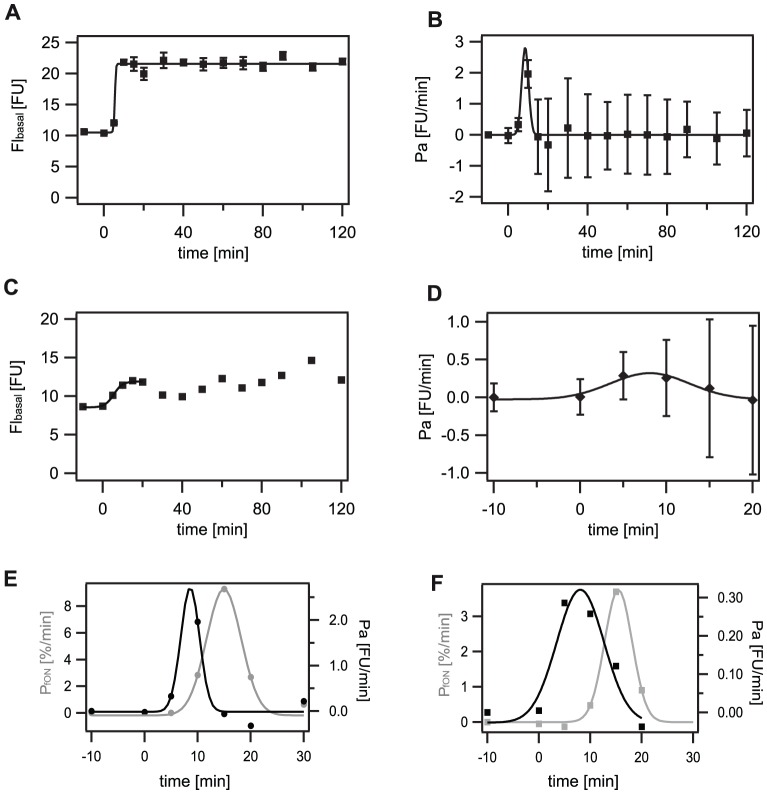
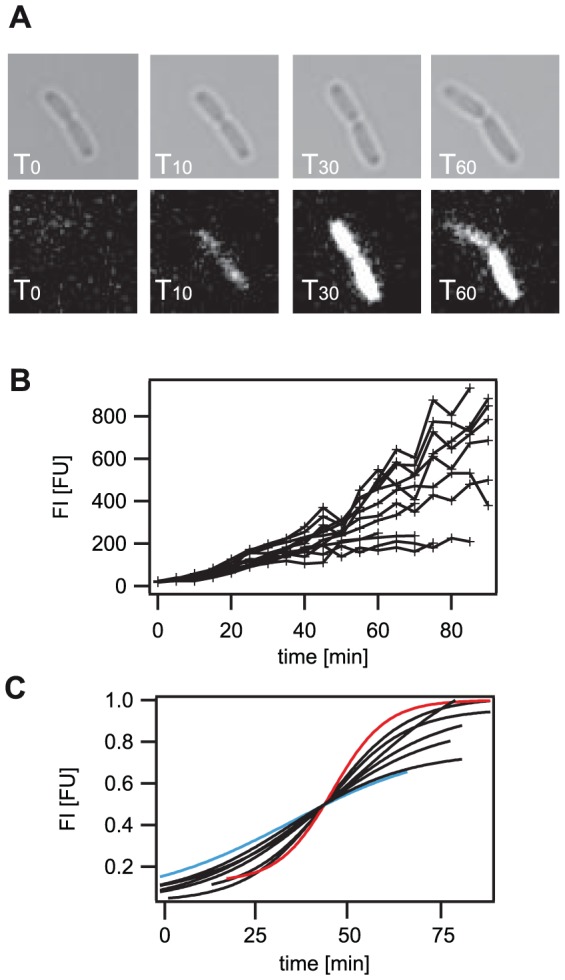
Methodology and principal findings: Here we study the response of the LiaFSR system to various concentrations of the peptide antibiotic bacitracin. Using quantitative fluorescence microscopy, we performed a whole population study analyzed on the single cell level. We investigated switching from the non-induced 'OFF' state into the bacitracin-induced 'ON' state by monitoring gene expression of a fluorescent reporter from the RR-regulated liaI promoter. We found that switching into the 'ON' state occurred within less than 20 min in a well-defined switching window, independent of the bacitracin concentration. The switching rate and the basal expression rate decreased at low bacitracin concentrations, establishing clear heterogeneity 60 min after bacitracin induction. Finally, we performed time-lapse microscopy of single cells confirming the quantitative response as obtained in the whole population analysis for high bacitracin concentrations.

Conclusion: The LiaFSR system exhibits an immediate, heterogeneous and graded response to the inducer bacitracin in the exponential growth phase.


Conflict of interest statement

Competing Interests: The authors have declared that no competing interests exist.

Figures

Figure 1
Figure 1. Core of the LiaFSR system.
Arrows denote upregulation and T-shaped lines indicate inhibition. The LiaFSR system of Bacillus subtilis consists of the two-component signal transducing system LiaRS and the accessory membrane protein LiaF, a LiaRS-specific inhibitor. Stress represented e.g. by cell wall antibiotics such as bacitracin is sensed by LiaS/F and leads to expression of the liaIH - liaGFSR (“lia locus” in the Figure) locus mediated by LiaR. To study the response of the Lia system to external stressors, we report activity of PliaI using the fluorescent marker GFP expressed under the control of the liaI promoter, chromosomally inserted ectopically in addition to the native Lia system. CM indicates the cytoplasmic membrane.
Figure 2
Figure 2. Expression profiles of the PliaI response in dependence of the bacitracin concentration.
Addition of bacitracin induced GFP expression. At T60 all cells reached their maximum fluorescence intensities. While at high bacitracin concentrations all cells shifted to high fluorescence values, at low bacitracin concentrations (1 and 0.3 µg/ml) a fraction of cells did not express GFP. The observed decrease of fluorescence intensities after T60 is attributed to ongoing cell division. A) Autofluorescence (∼8 FU) of Bacillus subtilis cells recorded shortly before bacitracin addition at T0. B) Representative images of B. subtilis cells 60 min after bacitracin induction. Bacitracin concentration is given in the right upper corner of each image in µg/ml. C)–F) Histograms of GFP expression from the liaI promoter for different time points, at C) 30 µg/ml bacitracin (T7 = 7 min after bacitracin induction), D) 3 µg/ml bacitracin, E) 1 µg/ml bacitracin, and F) 0.3 µg/ml bacitracin.
Figure 3
Figure 3. Definition of the switching threshold.
Histograms of GFP fluorescence intensity at various time points. A) 30 µg/ml bacitracin, B) 3 µg/ml bacitracin. T0: time point of bacitracin induction representing the autofluorescence with ∼8 FU. T7 and T10: Time points 7 and 10 min after bacitracin induction representing the phase at which cells are switching into the ‘ON’ state. At T14 and T15 (14 and 15 min after bacitracin induction) all cells have switched and the fluorescence distribution is clearly shifted towards higher fluorescence values. T7 and T10 therefore represent intermediate switching states and have therefore been used to determine the switching threshold as described in the Materials and Methods section. Red line: Gaussian fit. For details on the fit parameters see Table S1.
Figure 4
Figure 4. Fraction of cells in the ‘ON’ state as a function of time (fON(T)) and switching rate (PfON).
For definition of the switching threshold see description in the Materials and Method section. The fraction of cells in the ‘ON’ state (fON) increased with time, finally saturating at its maximal level. The maximal fraction of cells in the ‘ON’ state (fONmax) decreased with the bacitracin concentration. Similarly, the maximal switching rate (PfONmax) decreased at low bacitracin concentrations (e.g. 0.3 µg/ml). A, C, E, G) Fraction of cells in the ‘ON’ state as a function of time (fON). Solid line: best fit to a sigmoid function as previously described in (Table S2). B, D, F, H) Switching rate (PfON). The switching rate was determined as the first derivative with respect to time of the fraction of cells in the ‘ON’ state. Solid line: best fit to a Gaussian function (Table S3). A and B: 30 µg/ml bacitracin; C and D: 3 µg/ml bacitracin; E and F: 1 µg/ml bacitracin, G and H: 0.3 µg/ml bacitracin.
Figure 5
Figure 5. Basal expression rate (Pa) of PliaI at 1 and 0.3 µg/ml bacitracin.
The average fluorescence intensities (FIbasal) of cells in the ‘OFF’ state increased with time, saturating shortly thereafter. This enabled us to determine the basal expression rate (Pa) as described in the Material and Methods section. The maximal basal fluorescence intensity decreased with lower bacitracin concentrations. Similarly, the basal expression rate was significantly reduced in experiments with 0.3 µg/ml bacitracin as compared to 1 µg/ml bacitracin. A) and C) Fluorescence development of cells being in the ‘OFF’ state (FIbasal). Solid line: best fit to a sigmoid function (Table S6). B) and D) Expression rate of PliaI as the first derivative of fluorescence development given in A) and C). Solid line: best fit to a Gaussian function (Table S7). A) and B): 1 µg/ml bacitracin, C) and D) 0.3 µg/ml bacitracin. E) and F) comparison of switching rate PfON (grey) and basal expression rate Pa (black). E) 1 µg/ml bacitracin. F) 0.3 µg/ml bacitracin.
Figure 6
Figure 6. Switching characteristics of single cells at 30 µg/ml bacitracin.
Fluorescence development of single cells over time at 30 µg/ml bacitracin was comparable to the data obtained by single cell analysis of the above described population study: All cells switched into the induced ‘ON’ state, exceeding the threshold fluorescence intensity within 15 min. In contrast to the whole population study the maximal fluorescence intensity was reached only after 80 min. A) Fluorescence development of one individual cell is shown. Top: bright field images at different time points. Bottom: fluorescence images at different time points. B) Fluorescence development of 13 individual cells is shown. C) Sigmoidal fits have been applied to eight fluorescence intensity traces in Figure 6B. The fluorescence intensity was normalized to the maximum fluorescence intensity and the time axis was shifted to T45, where cells had half-maximum fluorescence intensity. Blue and red line: two individual fluorescence traces representing cells with the slowest and highest individual switching rates in this cell batch.

Similar articles

Cited by

References

    1. Kato A, Mitrophanov Y, Groisman EY (2007) A connector of two-component regulatory systems promotes signal amplification and persistence of expression. Proc Natl Acad Sci U S A 104: 12063–12068. - PMC - PubMed
    1. Castelli M, Vescvi EG, Soncini FC (2000) The phosphatase activity is the target for Mg2+ regulation of the sensor protein PhoQ in Salmonella . J Biol Chem 275: 22948–22954. - PubMed
    1. Li M, Wang C, Feng Y, Pan X, Cheng G, et al. (2008) SalK/SalR, a two-component signal transduction system, is essential for full virulence of highly invasive Streptococcus suis serotype 2. PloS One 3 (5) e2080 Accessed 09 June 2012. - PMC - PubMed
    1. Stock A, Robinson VL, Gourdreau PN (2000) Two-component signal transduction. Annu Rev Biochem 69: 183–215. - PubMed
    1. Nagasawa S, Tokishita S, Aiba H, Mizuno T (1997) A novel sensor-regulator protein that belongs to the homologous family of signal transduction proteins involved in adaptive responses in Escherichia coli . DNA Res 4: 161–168. - PubMed

Publication types

MeSH terms

LinkOut - more resources