

Perceptual learning of motion direction discrimination with suppressed and unsuppressed MT in humans: an fMRI study
- PMID: 23326433
- PMCID: PMC3541224
- DOI: 10.1371/journal.pone.0053458
Perceptual learning of motion direction discrimination with suppressed and unsuppressed MT in humans: an fMRI study
Abstract
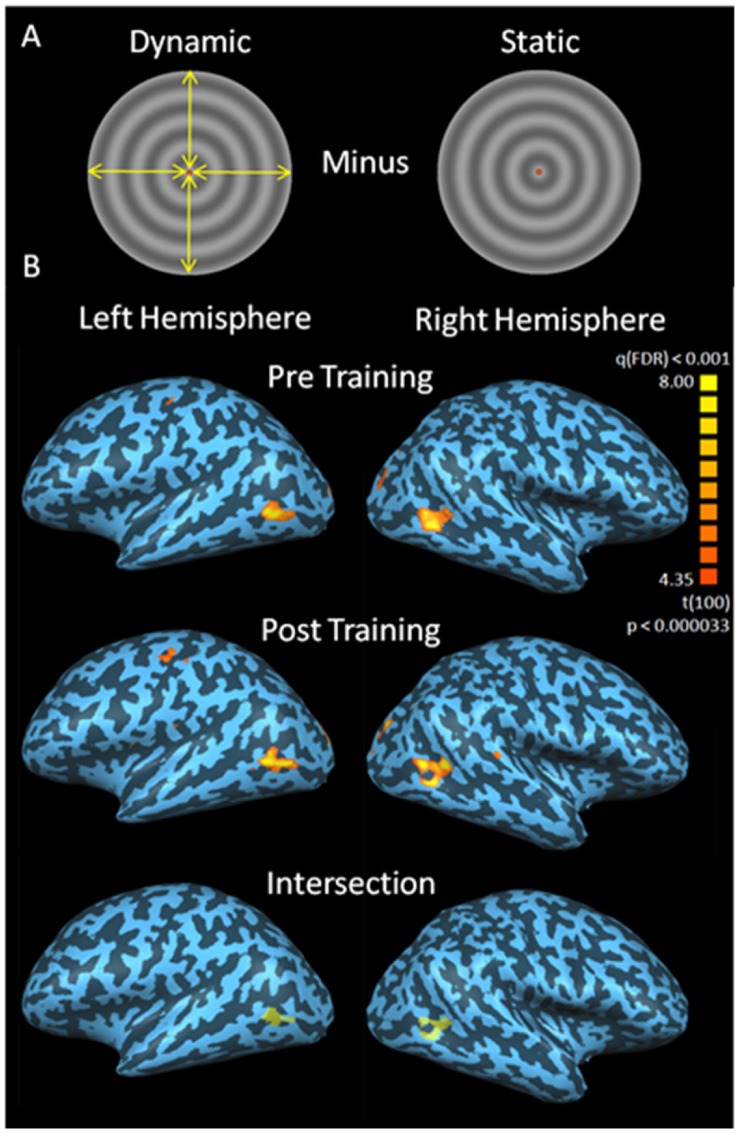
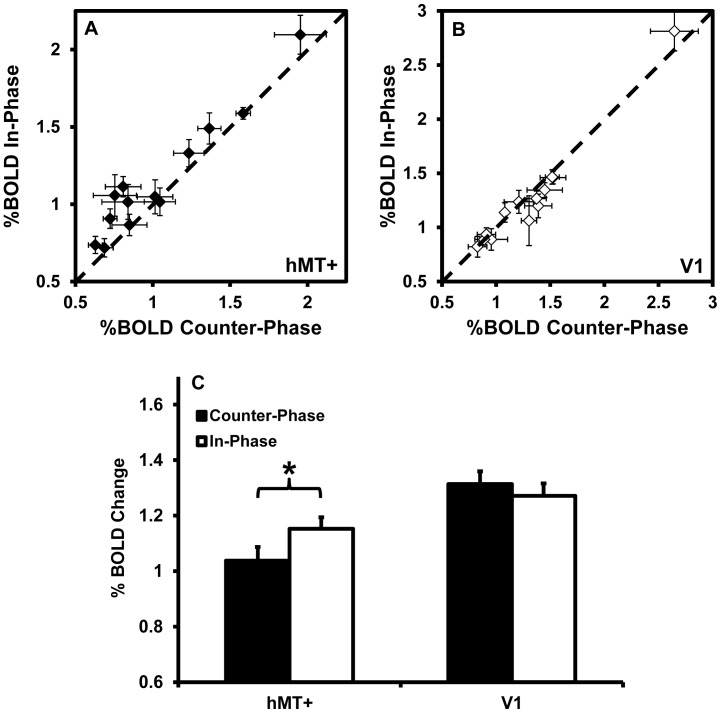
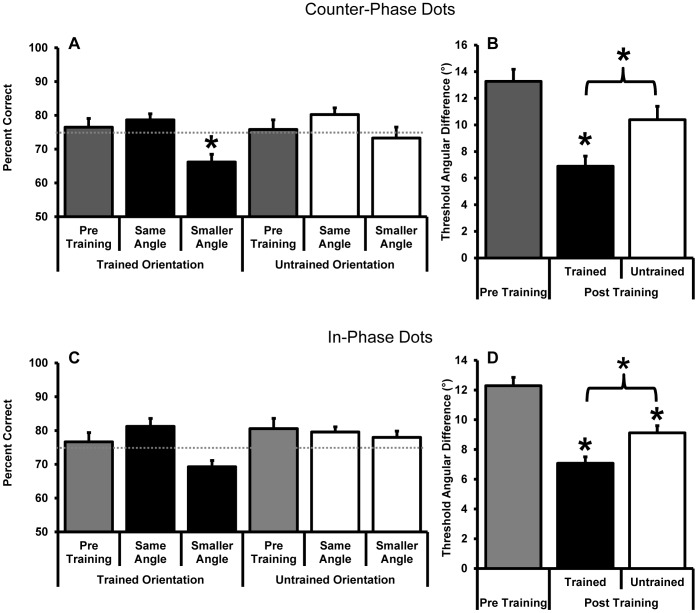
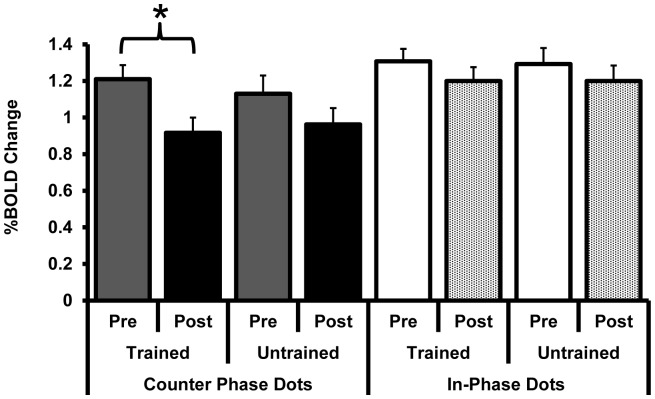
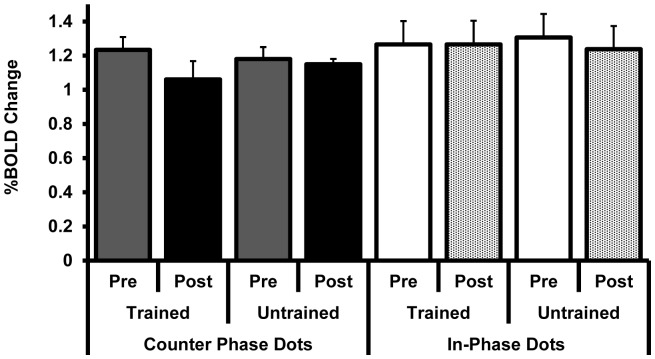
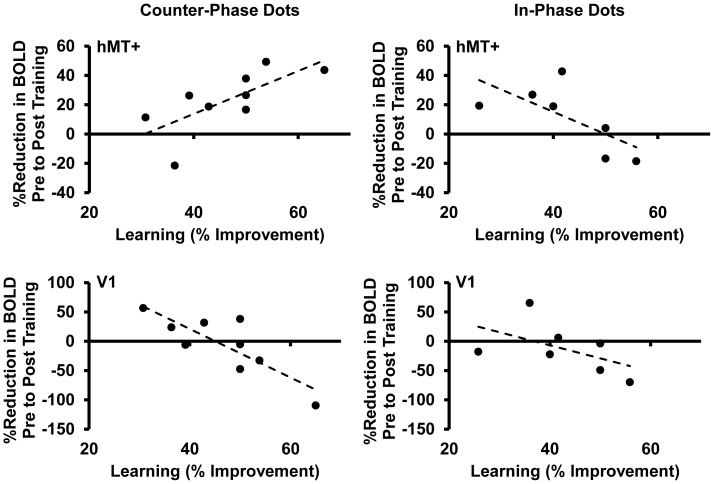
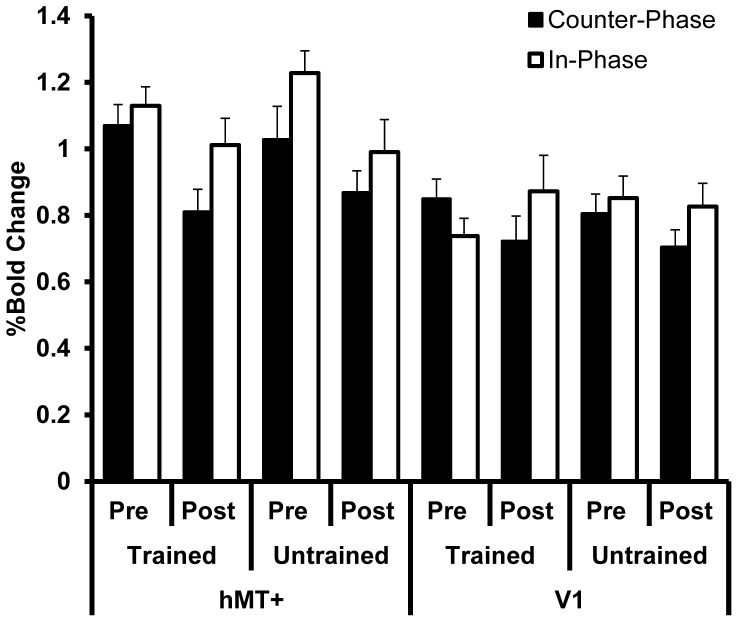
The middle temporal area of the extrastriate visual cortex (area MT) is integral to motion perception and is thought to play a key role in the perceptual learning of motion tasks. We have previously found, however, that perceptual learning of a motion discrimination task is possible even when the training stimulus contains locally balanced, motion opponent signals that putatively suppress the response of MT. Assuming at least partial suppression of MT, possible explanations for this learning are that 1) training made MT more responsive by reducing motion opponency, 2) MT remained suppressed and alternative visual areas such as V1 enabled learning and/or 3) suppression of MT increased with training, possibly to reduce noise. Here we used fMRI to test these possibilities. We first confirmed that the motion opponent stimulus did indeed suppress the BOLD response within hMT+ compared to an almost identical stimulus without locally balanced motion signals. We then trained participants on motion opponent or non-opponent stimuli. Training with the motion opponent stimulus reduced the BOLD response within hMT+ and greater reductions in BOLD response were correlated with greater amounts of learning. The opposite relationship between BOLD and behaviour was found at V1 for the group trained on the motion-opponent stimulus and at both V1 and hMT+ for the group trained on the non-opponent motion stimulus. As the average response of many cells within MT to motion opponent stimuli is the same as their response to non-directional flickering noise, the reduced activation of hMT+ after training may reflect noise reduction.
Conflict of interest statement
Figures
Similar articles
-
Psychophysical and rTMS Evidence for the Presence of Motion Opponency in Human V5.Brain Stimul. 2016 Nov-Dec;9(6):876-881. doi: 10.1016/j.brs.2016.05.012. Epub 2016 Jun 11. Brain Stimul. 2016. PMID: 27342938 Free PMC article.
-
Increase in MST activity correlates with visual motion learning: A functional MRI study of perceptual learning.Hum Brain Mapp. 2018 Jan;39(1):145-156. doi: 10.1002/hbm.23832. Epub 2017 Sep 30. Hum Brain Mapp. 2018. PMID: 28963815 Free PMC article.
-
Motion opponency at the middle temporal cortex: Preserved motion information and the effect of perceptual learning.Eur J Neurosci. 2022 Dec;56(12):6215-6226. doi: 10.1111/ejn.15850. Epub 2022 Nov 18. Eur J Neurosci. 2022. PMID: 36266211
-
Perceptual learning: top to bottom.Vision Res. 2014 Jun;99:69-77. doi: 10.1016/j.visres.2013.11.006. Epub 2013 Dec 1. Vision Res. 2014. PMID: 24296314 Review.
-
Can theories of animal discrimination explain perceptual learning in humans?Psychol Bull. 2014 Jan;140(1):283-307. doi: 10.1037/a0032765. Epub 2013 May 6. Psychol Bull. 2014. PMID: 23647232 Review.
Cited by
-
Neuroimaging Evidence for 2 Types of Plasticity in Association with Visual Perceptual Learning.Cereb Cortex. 2016 Sep;26(9):3681-9. doi: 10.1093/cercor/bhw176. Epub 2016 Jun 13. Cereb Cortex. 2016. PMID: 27298301 Free PMC article.
-
Fluoxetine Does Not Enhance Visual Perceptual Learning and Triazolam Specifically Impairs Learning Transfer.Front Hum Neurosci. 2016 Oct 19;10:532. doi: 10.3389/fnhum.2016.00532. eCollection 2016. Front Hum Neurosci. 2016. PMID: 27807412 Free PMC article.
-
Motion opponency examined throughout visual cortex with multivariate pattern analysis of fMRI data.Hum Brain Mapp. 2021 Jan;42(1):5-13. doi: 10.1002/hbm.25198. Epub 2020 Sep 2. Hum Brain Mapp. 2021. PMID: 32881175 Free PMC article.
-
Psychophysical and rTMS Evidence for the Presence of Motion Opponency in Human V5.Brain Stimul. 2016 Nov-Dec;9(6):876-881. doi: 10.1016/j.brs.2016.05.012. Epub 2016 Jun 11. Brain Stimul. 2016. PMID: 27342938 Free PMC article.
-
Increase in MST activity correlates with visual motion learning: A functional MRI study of perceptual learning.Hum Brain Mapp. 2018 Jan;39(1):145-156. doi: 10.1002/hbm.23832. Epub 2017 Sep 30. Hum Brain Mapp. 2018. PMID: 28963815 Free PMC article.
References
-
- Epstein W (1967) Varieties of Perceptual Learning. New York, St. Louis, San Francisco, Toronto, London, Sydney: McGraw-Hill Book Company.
-
- Gibson EJ (1969) Principles of perceptual learning and development. New York,: Appleton-Century-Crofts.
-
- Gibson EJ (1991) An odyssey in learning and perception; Gibson EJ, editor. Cambridge, Massachusetts; London, England: A Bradford Book, The MIT Press.
-
- Ball K, Sekuler R (1987) Direction-specific improvement in motion discrimination. Vision Res 27: 953–965. - PubMed
Publication types
MeSH terms
Substances
Grants and funding
LinkOut - more resources
Full Text Sources
Other Literature Sources
Medical
Research Materials
