

Metabolic side-effects of the novel second-generation antipsychotic drugs asenapine and iloperidone: a comparison with olanzapine
- PMID: 23326434
- PMCID: PMC3541274
- DOI: 10.1371/journal.pone.0053459
Metabolic side-effects of the novel second-generation antipsychotic drugs asenapine and iloperidone: a comparison with olanzapine
Abstract
Background: The second generation antipsychotic (SGA) drugs are widely used in psychiatry due to their clinical efficacy and low incidence of neurological side-effects. However, many drugs in this class cause deleterious metabolic side-effects. Animal models accurately predict metabolic side-effects for SGAs with known clinical metabolic liability. We therefore used preclinical models to evaluate the metabolic side-effects of glucose intolerance and insulin resistance with the novel SGAs asenapine and iloperidone for the first time. Olanzapine was used as a comparator.
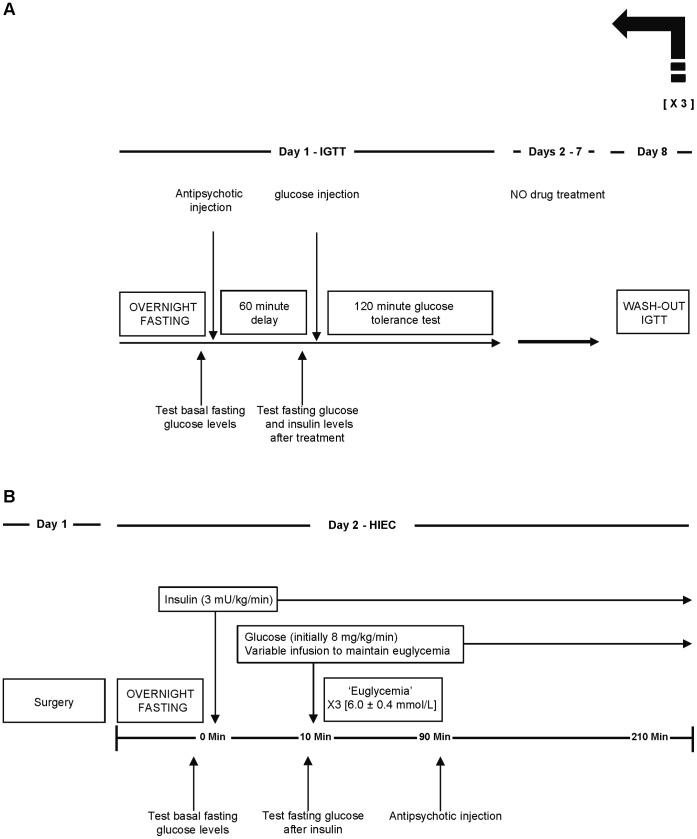
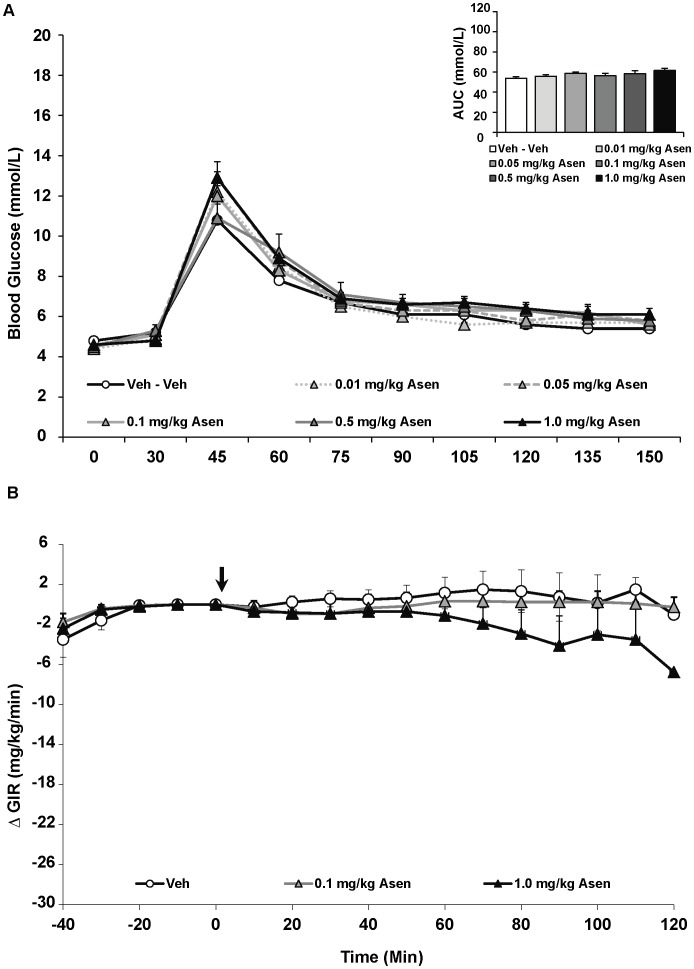
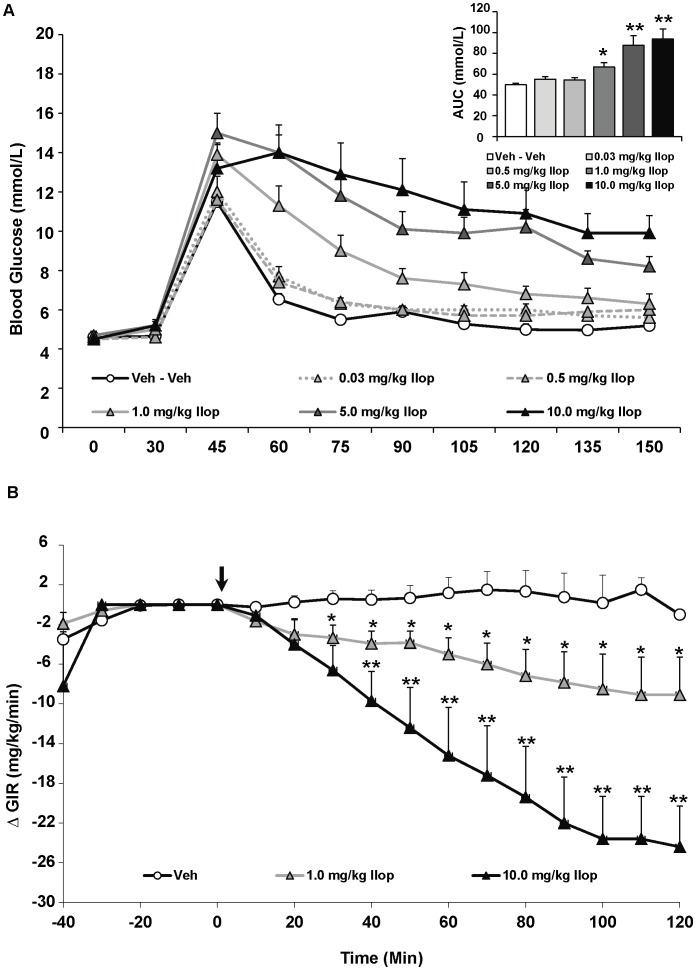
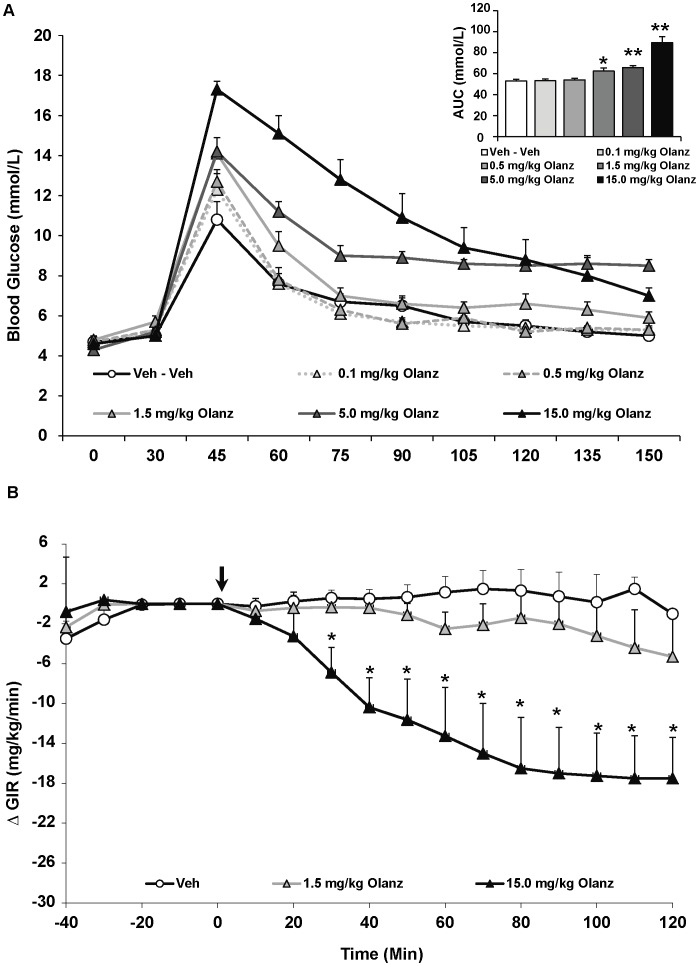
Methods: Adults female rats were treated with asenapine (0.01, 0.05, 0.1, 0.5, 1.0 mg/kg), iloperidone (0.03, 0.5, 1.0, 5.0, 10.0 mg/kg) or olanzapine (0.1, 0.5, 1.5, 5.0, 10.0 mg/kg) and subjected to the glucose tolerance test (GTT). Separate groups of rats were treated with asenapine (0.1 and 1.0 mg/kg), iloperidone (1.0 and 10 mg/kg) or olanzapine (1.5 and 15 mg/kg) and tested for insulin resistance with the hyperinsulinemic-euglycemic clamp (HIEC).
Results: Asenapine showed no metabolic effects at any dose in either test. Iloperidone caused large and significant glucose intolerance with the three highest doses in the GTT, and insulin resistance with both doses in the HIEC. Olanzapine caused significant glucose intolerance with the three highest doses in the GTT, and insulin resistance with the higher dose in the HIEC.
Conclusions: In preclinical models, asenapine shows negligible metabolic liability. By contrast, iloperidone exhibits substantial metabolic liability, comparable to olanzapine. These results emphasize the need for appropriate metabolic testing in patients treated with novel SGAs where current clinical data do not exist.
Conflict of interest statement
Figures
Similar articles
-
An evaluation of the effects of the novel antipsychotic drug lurasidone on glucose tolerance and insulin resistance: a comparison with olanzapine.PLoS One. 2014 Sep 25;9(9):e107116. doi: 10.1371/journal.pone.0107116. eCollection 2014. PLoS One. 2014. PMID: 25254366 Free PMC article.
-
Comparison of the Metabolic Characteristics of Newer Second Generation Antipsychotics: Brexpiprazole, Lurasidone, Asenapine, Cariprazine, and Iloperidone With Olanzapine as a Comparator.J Clin Psychopharmacol. 2021 Jan/Feb 01;41(1):5-12. doi: 10.1097/JCP.0000000000001318. J Clin Psychopharmacol. 2021. PMID: 33177350
-
Pathophysiology of drug induced weight and metabolic effects: findings from an RCT in healthy volunteers treated with olanzapine, iloperidone, or placebo.J Psychopharmacol. 2018 May;32(5):533-540. doi: 10.1177/0269881118754708. Epub 2018 Feb 15. J Psychopharmacol. 2018. PMID: 29444618 Free PMC article. Clinical Trial.
-
Iloperidone, asenapine, and lurasidone: a brief overview of 3 new second-generation antipsychotics.Postgrad Med. 2011 Mar;123(2):153-62. doi: 10.3810/pgm.2011.03.2273. Postgrad Med. 2011. PMID: 21474903 Review.
-
Iloperidone, asenapine and lurasidone: a primer on their current status.Expert Opin Pharmacother. 2012 Sep;13(13):1911-22. doi: 10.1517/14656566.2012.712114. Epub 2012 Jul 31. Expert Opin Pharmacother. 2012. PMID: 22849428 Review.
Cited by
-
Antipsychotic Drug-Induced Increases in Peripheral Catecholamines are Associated With Glucose Intolerance.Front Pharmacol. 2022 Feb 15;13:765905. doi: 10.3389/fphar.2022.765905. eCollection 2022. Front Pharmacol. 2022. PMID: 35242029 Free PMC article.
-
The Effect of Chronic Iloperidone Treatment on Cytochrome P450 Expression and Activity in the Rat Liver: Involvement of Neuroendocrine Mechanisms.Int J Mol Sci. 2021 Aug 6;22(16):8447. doi: 10.3390/ijms22168447. Int J Mol Sci. 2021. PMID: 34445153 Free PMC article.
-
Olanzapine: A potent agonist at the hM4D(Gi) DREADD amenable to clinical translation of chemogenetics.Sci Adv. 2019 Apr 17;5(4):eaaw1567. doi: 10.1126/sciadv.aaw1567. eCollection 2019 Apr. Sci Adv. 2019. PMID: 31001591 Free PMC article.
-
Improving metabolic and cardiovascular health at an early psychosis intervention program in vancouver, Canada.Front Psychiatry. 2014 Sep 5;5:105. doi: 10.3389/fpsyt.2014.00105. eCollection 2014. Front Psychiatry. 2014. PMID: 25249985 Free PMC article.
-
Long-Term Treatment with Atypical Antipsychotic Iloperidone Modulates Cytochrome P450 2D (CYP2D) Expression and Activity in the Liver and Brain via Different Mechanisms.Cells. 2021 Dec 9;10(12):3472. doi: 10.3390/cells10123472. Cells. 2021. PMID: 34943983 Free PMC article.
References
-
- Procyshyn RM, Honer WG, Wu TK, Ko RW, McIsaac SA, et al. (2010) Persistent antipsychotic polypharmacy and excessive dosing in the community psychiatric treatment setting: a review of medication profiles in 435 Canadian outpatients. J Clin Psychiatry 71: 566–573. - PubMed
-
- Newcomer JW (2007) Antipsychotic medications: metabolic and cardiovascular risk. J Clin Psychiatry 68 Suppl 48–13. - PubMed
-
- Henderson DC (2008) Managing weight gain and metabolic issues in patients treated with atypical antipsychotics. J Clin Psychiatry 69: e04. - PubMed
Publication types
MeSH terms
Substances
LinkOut - more resources
Full Text Sources
Other Literature Sources
