. 2013;8(1):e53664.
doi: 10.1371/journal.pone.0053664. Epub 2013 Jan 11.

bis-Dehydroxy-Curcumin triggers mitochondrial-associated cell death in human colon cancer cells through ER-stress induced autophagy

Affiliations

bis-Dehydroxy-Curcumin triggers mitochondrial-associated cell death in human colon cancer cells through ER-stress induced autophagy

Valentina Basile et al. PLoS One. 2013.

Abstract

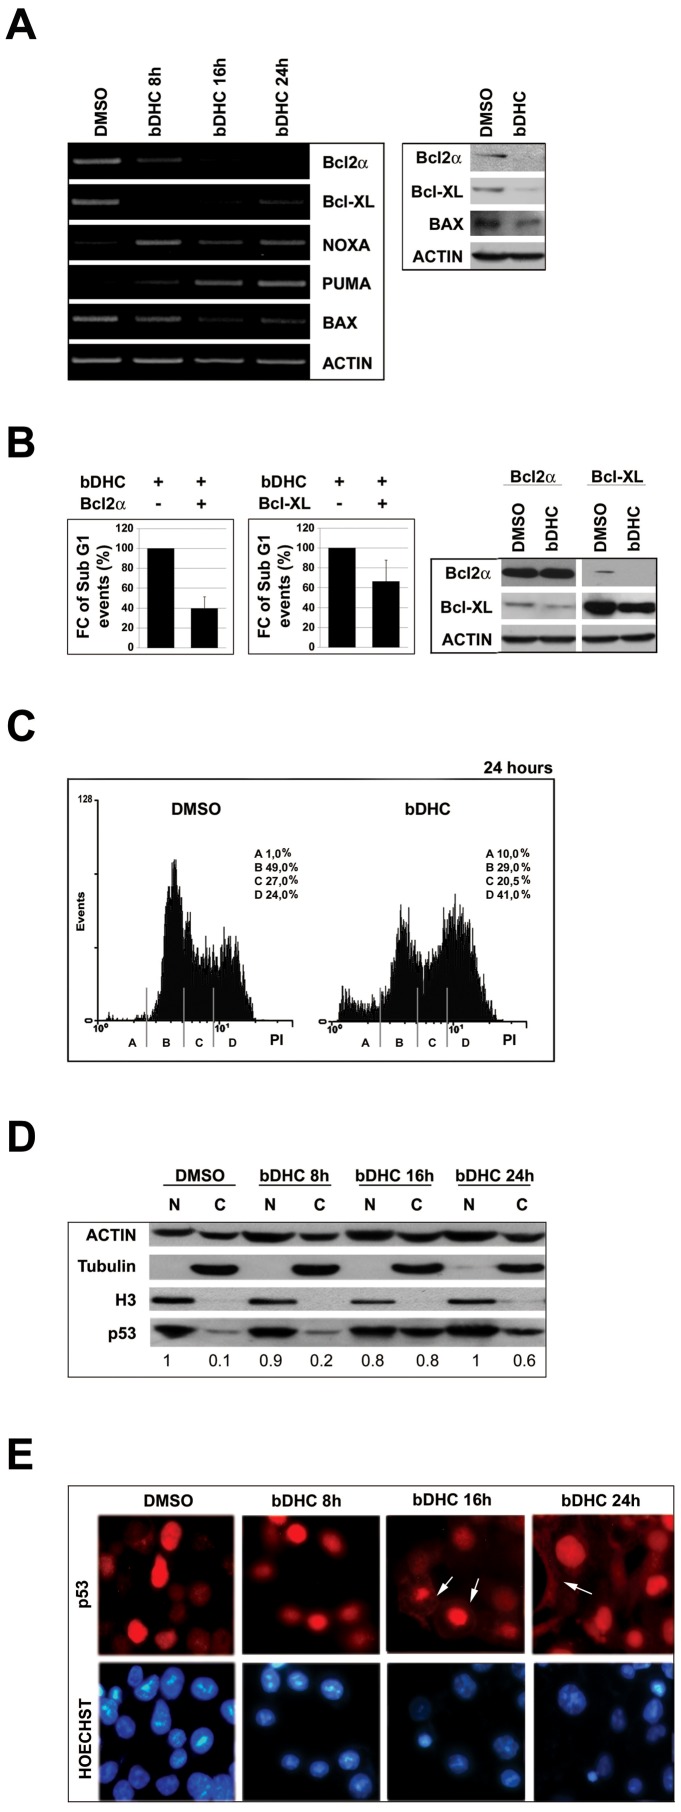
Background: The activation of autophagy has been extensively described as a pro-survival strategy, which helps to keep cells alive following deprivation of nutrients/growth factors and other stressful cellular conditions. In addition to cytoprotective effects, autophagy can accompany cell death. Autophagic vacuoles can be observed before or during cell death, but the role of autophagy in the death process is still controversial. A complex interplay between autophagy and apoptosis has come to light, taking into account that numerous genes, such as p53 and Bcl-2 family members, are shared between these two pathways.

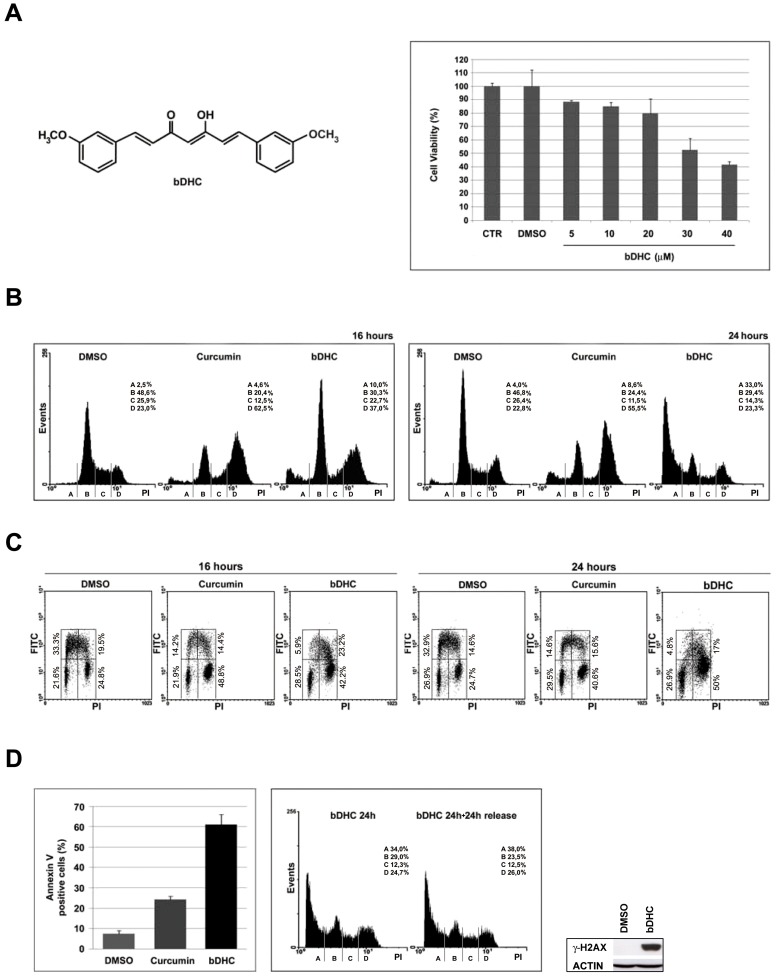
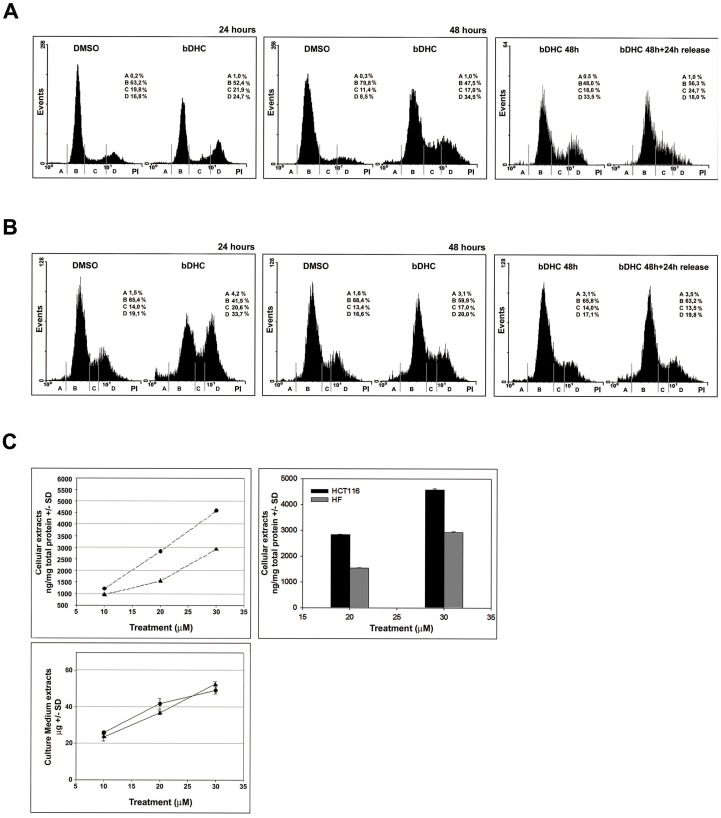
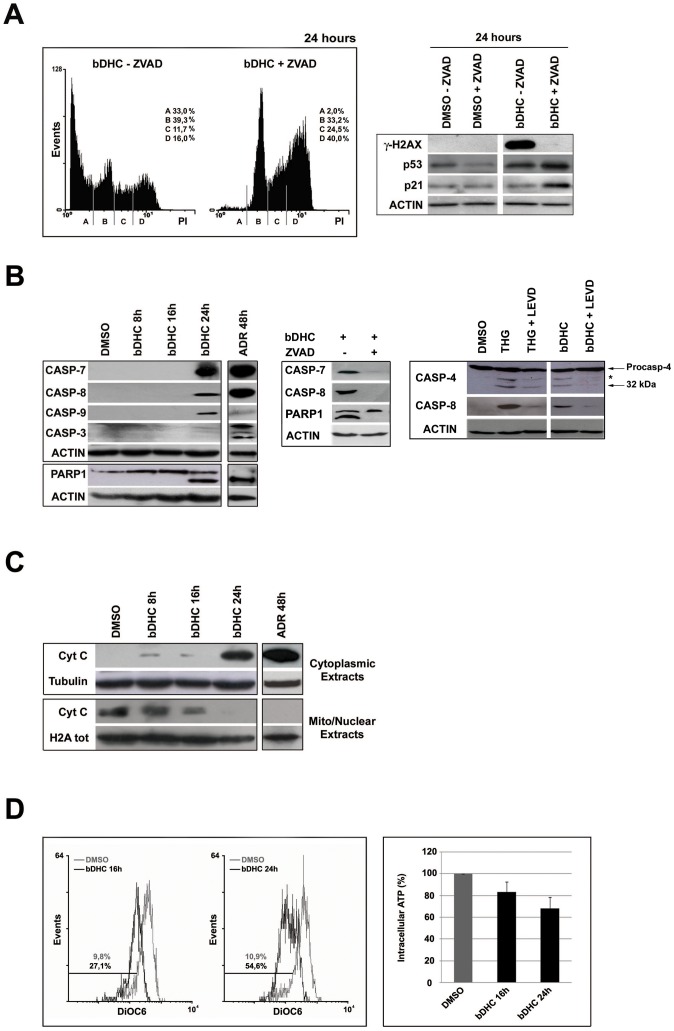
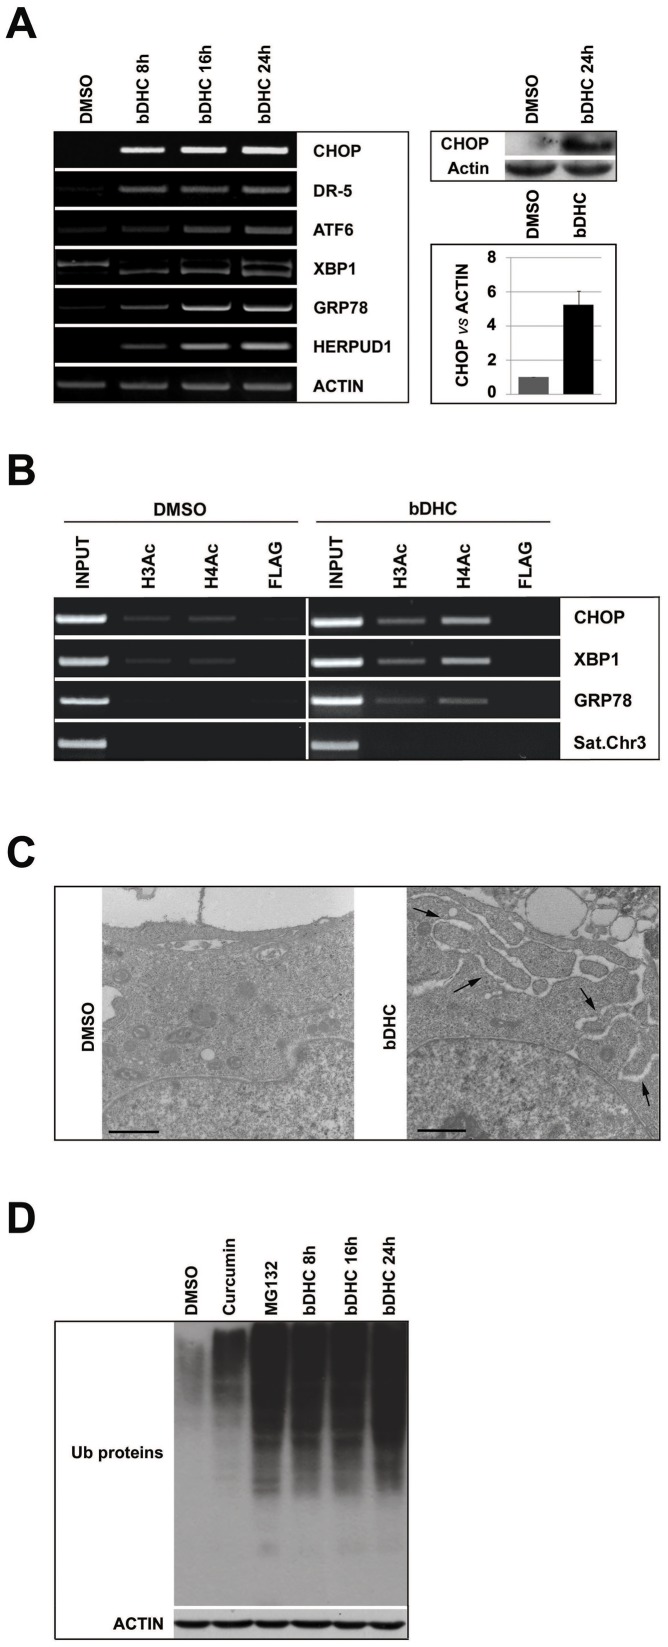
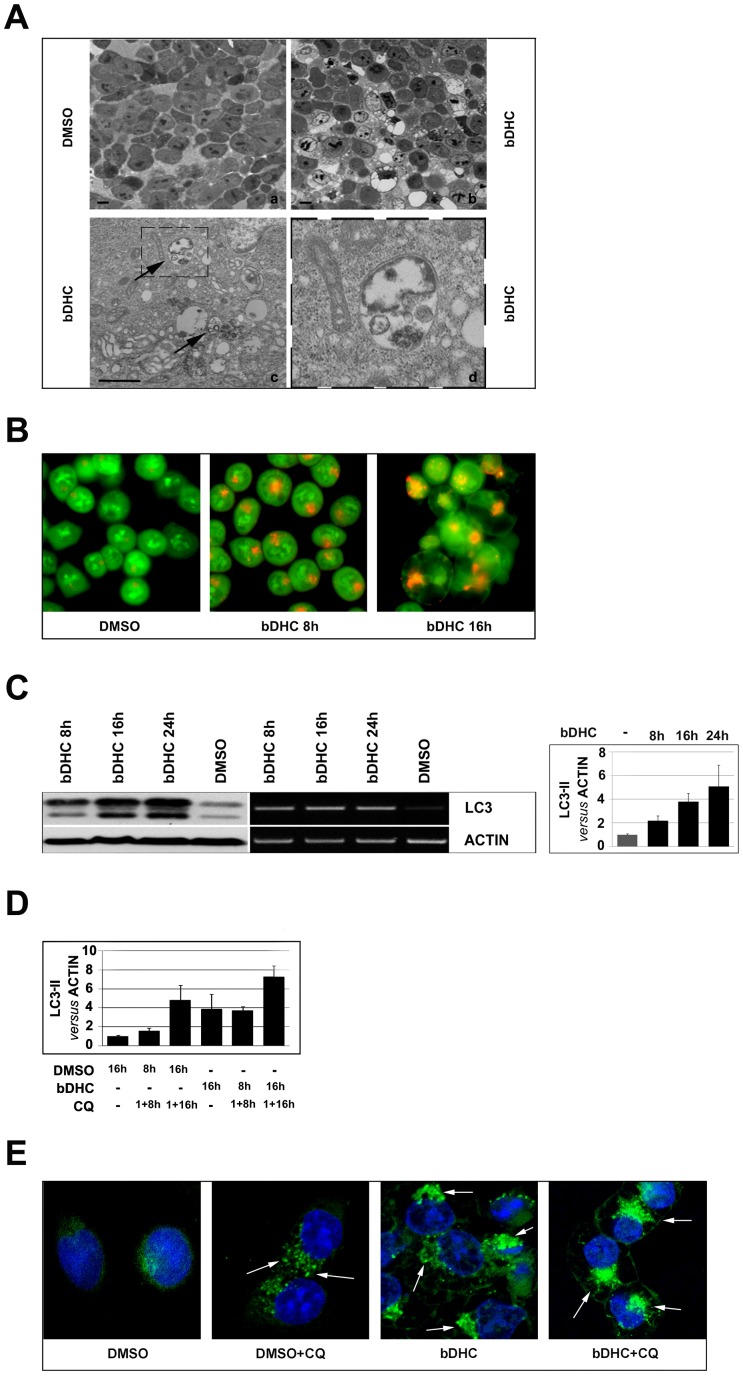
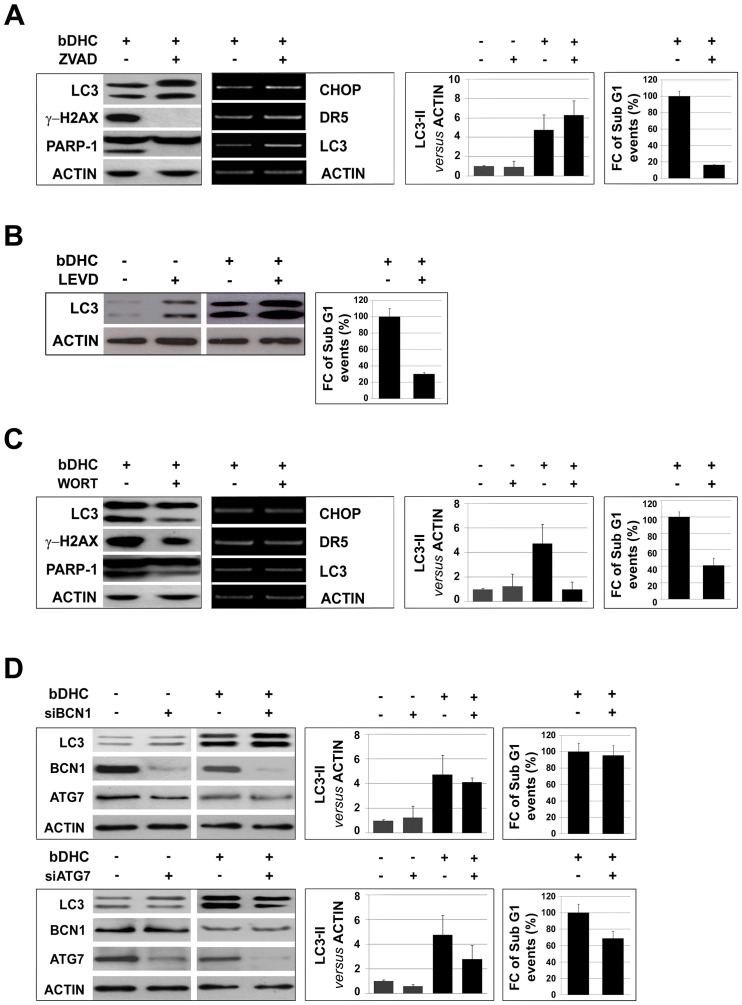
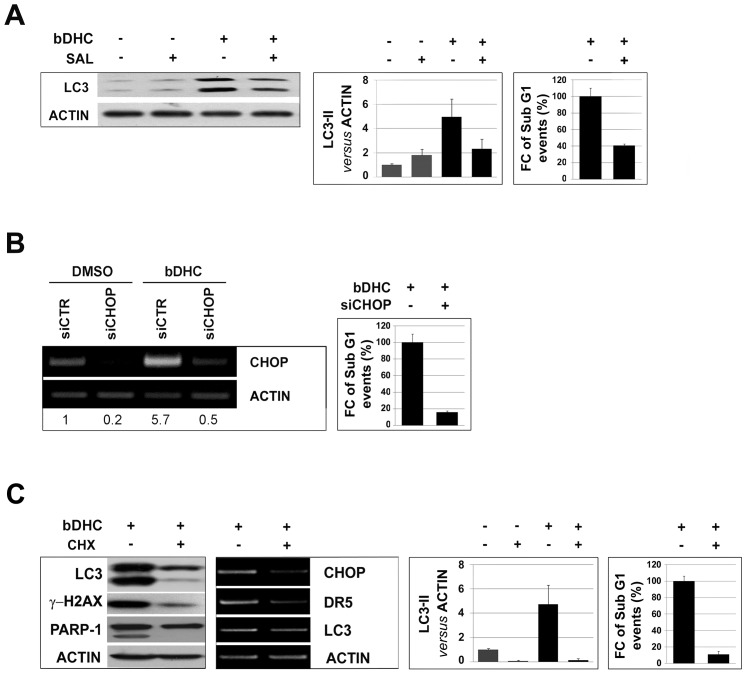
Methodology/principal findings: In this study we showed a potent and irreversible cytotoxic activity of the stable Curcumin derivative bis-DeHydroxyCurcumin (bDHC) on human colon cancer cells, but not on human normal cells. Autophagy is elicited by bDHC before cell death as demonstrated by increased autophagosome formation -measured by electron microscopy, fluorescent LC3 puncta and LC3 lipidation- and autophagic flux -measured by interfering LC3-II turnover. The accumulation of poly-ubiquitinated proteins and ER-stress occurred upstream of autophagy induction and resulted in cell death. Cell cycle and Western blot analyses highlighted the activation of a mitochondrial-dependent apoptosis, which involves caspase 7, 8, 9 and Cytochrome C release. Using pharmacological inhibitions and RNAi experiments, we showed that ER-stress induced autophagy has a major role in triggering bDHC-cell death.

Conclusion/significance: Our findings describe the mechanism through which bDHC promotes tumor selective inhibition of proliferation, providing unequivocal evidence of the role of autophagy in contrasting the proliferation of colon cancer cells.


Conflict of interest statement

Competing Interests: The authors have declared that no competing interests exist.

Figures

Figure 1
Figure 1. bDHC induces cell cycle impairment and apoptosis in HCT116 cells.
A. Left panel: Structure of bDHC. Right panel: Dose-response effect of bDHC on cell viability upon 24 hours treatment, compared to control and DMSO-treated cells. B. PI/FACS analysis of cell cycle progression after DMSO, Curcumin (10 µM) and bDHC (30 µM) treatments for 16 and 24 hours (left and right panel, respectively). The indicated events are means of ten independent experiments (A = SubG1, B = G0/G1, C = S, D = G2/M). C. PI/BrdU bivariate FACS analysis of 16 and 24 hours treatments with DMSO, Curcumin and bDHC. Analysis was gated to exclude SubG1 population. D. Left panel: The percentage of Annexin V positive cells upon 24 hours treatment with bDHC is compared to DMSO- and Curcumin-treated cells. Data are means of three independent experiments −/+ SD. Middle panel: PI/monoparametric cell cycle analysis of bDHC-treated cells versus bDHC-cells released for 24 hours in fresh medium. Events are indicated as means of three independent experiments (A = SubG1, B = G0/G1, C = S, D = G2/M). Right panel: γ-H2AX expression levels versus actin in cells treated with bDHC for 24 hours.
Figure 2
Figure 2. Reversible anti-proliferative activity of bDHC on human normal cells.
A. PI/FACS analysis of HF cell cycle progression after DMSO and bDHC treatments for 24 and 48 hours (left and middle panel, respectively). PI/monoparametric cell cycle analysis of bDHC-treated cells versus bDHC-released cells (right panel) (A = SubG1, B = G0/G1, C = S, D = G2/M). B. Left and middle panels: Analysis of cell cycle progression of WRL68 cells following 24 and 48 hours of treatment with DMSO or bDHC. Right panel: PI/FACS monoparametric analysis of WRL68 cells treated with bDHC for 48 hours and then released into fresh medium for additional 24 hours (A = SubG1, B = G0/G1, C = S, D = G2/M). C. Quantitative evaluation of bDHC concentration by UV-vis spectroscopy. Upper left panel: bDHC recovered from cell lysates of HCT116 (•) and HF (▴) cells after 24 hours treatment at different concentrations (10, 20 and 30 µM). bDHC recovered from cell pellets (ng) was referred to total cellular proteins (mg), determined using Bradford method. Upper right panel: Comparison of cellular uptake (20 and 30 µM concentrations) in HCT116 (black histograms) and HF cells (grey histograms). Lower panel: bDHC recovered from culture media following incubation of HCT116 (•) and HF (▴) cells with bDHC at 10, 20 and 30 µM concentration. All data were normalized on control (DMSO). Drug amount was determined by reading absorbance at λmax = 393 nm. Reported values are an average of three independent experiments −/+ SD.
Figure 3
Figure 3. Caspases activation upon bDHC treatment in HCT116 cells.
A. Left panel: PI/monoparametric analysis of cell cycle progression of bDHC-treated cells with or without ZVAD pre-incubation. The indicated events are means of three independent experiments (A = SubG1, B = G0/G1, C = S, D = G2/M). Right panel: Western blot analysis of the indicated proteins after DMSO and bDHC treatment with or without ZVAD co-incubation. Actin was used as loading control. B. Left panel: Expression analysis of cleaved-caspases and cleaved–PARP1 by Western blot following bDHC and Adriamycin administration. Actin was used as loading control. Middle panel: Western blot analysis of cleaved-caspases and PARP1 upon ZVAD pre-treatment compared to bDHC alone. Right panel: Expression levels of cleaved caspase 4 and 8 in HCT116 cells incubated with bDHC for 24 hours and co-treated with LEVD. Thapsigargin (THG) treatment for 36 hours was used as positive control. Protein loading was assessed by probing the blot with anti-actin antibody. The asterisk in caspase 4 blot indicates a band derived from unknown cleavage. C. Cytochrome C expression analysis in cytoplasmic and mitochondrial/nuclear extracts from HCT116 treated with bDHC for 8, 16 and 24 hours. Tubulin and total histone H2A were used as loading controls of cytoplasmic and nuclear extracts, respectively. D. Left panel: Flow Cytometric analysis of mitochondrial membrane potential (Δψ) by measuring DiOC6 binding in HCT116 cells following administration of bDHC for 16 and 24 hours. The percentage of cells with decreased Δψ is indicated. Right panel: ATP content in HCT116 cells following incubation with bDHC versus DMSO (arbitrarily set at 100%).
Figure 4
Figure 4. Role of Bcl-2 family members in bDHC-induced apoptosis.
A. Left panel: RT-PCR analysis of the indicated Bcl-2 family genes upon bDHC treatment for different times versus DMSO. Right panel: Protein expression levels of Bcl-2α, Bcl-XL and Bax following 24 hours treatment with bDHC. B. SubG1 (left panel) and Western blot analysis (right panel) of HCT116 cells upon transient transfection of Bcl-2α or Bcl-XL and treatment with DMSO or bDHC. Data are reported as fold change (FC) of SubG1 population in transfected cells treated with bDHC relative to bDHC-cells (arbitrarily set at 100%). C. PI/FACS analysis of cell cycle progression of HCT116 Bax −/− cells after DMSO and bDHC incubation for 24 hours. D. Western blot analysis of p53 expression in nuclear and cytosolic extracts of cells treated with DMSO and bDHC for 8, 16 and 24 hours. Tubulin and histone H3 were used as loading controls of cytosolic and nuclear extracts. The intensity of immunoreactive bands was quantitated to actin (basal nuclear p53 arbitrarily set at 1). Values are means of three independent experiments. E. Immunofluorescence analysis of endogenous p53 cellular localization in HCT116 following time-dependent exposure to bDHC. p53 cytoplasmic localization is indicated by white arrows.
Figure 5
Figure 5. Activation of ER stress response in bDHC-treated HCT116 cells.
A. Left panel: time-course mRNA expression analysis by RT-PCR of the indicated genes. CHOP protein expression (right upper panel) and quantification (right lower panel) after 24 hours treatment with bDHC versus DMSO. B. Changes in histones acetylation upon bDHC treatment. Anti-Acetylated histone H3 and H4 have been used for ChIP analysis of the indicated regulatory regions. C. Transmission Electron Microscopy analysis of ER in control and bDHC-treated cells. The black arrows indicate the expanded ER. Scale bar: 1 µm. D. Increase of protein ubiquitination in Curcumin (24 hours), MG132 (24 hours) and bDHC lysates (8, 16, 24 hours) by Western blot analysis. Actin was used as loading control.
Figure 6
Figure 6. bDHC induces autophagy in HCT116 cells.
A. Optical (a and b photomicrographs) and Scanning Electron Microscopy (c and d photomicrographs) representative images of cells treated with DMSO and bDHC for 24 hours. Photomicrograph of panel c shows the presence of autophagolysosomes in bDHC treated cells. Enlargement of the dashed box (panel d) illustrates a double-membraned autophagosome. Scale bar a and b panels: 10 µm; c panel: 1 µm. B. Detection of bDHC-induced autophagosomes formation by fluorescence microscopy following staining with Acridine Orange. C. Left panel: Western blot and RT-PCR analysis of LC3 expression at 8, 16 and 24 hours of bDHC exposure in HCT116 cells. Right panel shows the levels of LC3-II versus actin following time-dependent incubation with bDHC. Values are mean of six independent experiments −/+ SD. D. Quantification of LC3-II detected by Western blot analysis following pre-incubation (1 h) of DMSO and bDHC with Chloroquine (CQ). The levels of LC3-II have been normalized to actin. E. Fluorescence staining of endogenous LC3 following incubation of HCT116 cells with bDHC for 24 hours, with or without Chloroquine (CQ). LC3-stained autophagic compartments are indicated by white arrows.
Figure 7
Figure 7. Autophagy activation leads to cell death.
A. Left panels: LC3, γ-H2AX and PARP1 levels in bDHC cells co-treated with ZVAD. Middle left panel: RT-PCR analysis of the indicated genes normalized versus actin mRNA expression. Middle right panel: LC3-II levels versus actin with or without co-treatment. Right panels: Flow cytometric analysis of SubG1 events in cells with or without co-treatments. Data are reported as fold change (FC) of SubG1 population relative to bDHC-treated cells (arbitrarily set at 100%). B. Left panel: Western blot analysis of LC3 and actin levels following 24 hours co-treatment of DMSO or bDHC with LEVD. Right panel: Fold change (FC) of SubG1 events in cells co-treated with LEVD and bDHC versus bDHC-treated cells (arbitrarily set at 100%). C. Left panels: LC3, γ-H2AX and PARP1 levels in bDHC cells co-treated with Wortmannin (WORT). Middle left panel: mRNA levels of the indicated genes normalized versus actin. Middle right panel: Expression levels of LC3-II normalized to actin with or without co-treatment. Right panels: Flow cytometric analysis of SubG1 events in cells with or without Wortmannin. Data are reported as fold change (FC) of SubG1 population relative to bDHC-treated cells (arbitrarily set at 100%). D. Left panels: Western blot analysis of LC3, Beclin1 (BCN1) and Atg7 expression levels in DMSO and bDHC treated cells following BCN1 (upper panel) and Atg7 (lower panel) knock down. Middle panels: LC3-II levels in control, BCN1 and Atg7 inactivated cells have been normalized versus actin levels. Values are mean of three independent experiments −/+ SD. Right panels: Fold change (FC) of SubG1 events of BCN1 and Atg7 inactivated bDHC-cells versus bDHC-treated cells (arbitrarily set at 100%).
Figure 8
Figure 8. ER stress precedes autophagy-mediated cell death.
A. Effects of Salubrinal (SAL) on bDHC-treated cells. Protein expression levels of LC3 (left panel) and LC3-II quantification versus actin levels (middle panel) in DMSO or bDHC cells co-treated with Salubrinal. Right panel: Fold change (FC) of SubG1 events in co-treated versus bDHC-treated cells (arbitrarily considered as 100%). Values are mean of three independent experiments −/+ SD. B. Left panel: RT-PCR analysis following CHOP inactivation. Values indicate the quantification of CHOP mRNA levels relative to actin. Right panel: Fold change (FC) of SubG1 events of CHOP inactivated bDHC-cells versus bDHC-treated cells (arbitrarily set at 100%). C. Effects of co-incubation of bDHC-treated cells with Cycloheximide (CHX). Left and middle left panels: Protein and mRNA expression levels of the indicated genes. Middle right panel: LC3-II levels were quantitated versus actin, before and after Cycloheximide co-administration. Right panel: Fold change (FC) of SubG1 events in co-treated versus bDHC-treated cells (arbitrarily considered as 100%). Values are mean of three independent experiments −/+ SD.

Similar articles

Cited by

References

    1. Taylor RC, Cullen SP, Martin SJ (2008) Apoptosis: controlled demolition at the cellular level. Nat Rev Mol Cell Biol 9: 231–241. - PubMed
    1. Igney FH, Krammer PH (2002) Death and anti-death: tumour resistance to apoptosis. Nat Rev Cancer 2: 277–288. - PubMed
    1. Cuervo AM (2004) Autophagy: many paths to the same end. Mol Cell Biochem 263: 55–72. - PubMed
    1. Cuervo AM, Macian F (2011) Autophagy, nutrition and immunology. Mol Aspects Med 33: 2–13. - PMC - PubMed
    1. Yorimitsu T, Klionsky DJ (2005) Autophagy: molecular machinery for self-eating. Cell Death Differ 12 Suppl 2: 1542–1552. - PMC - PubMed

Publication types

MeSH terms