. 2013;8(1):e53668.
doi: 10.1371/journal.pone.0053668. Epub 2013 Jan 9.

Combination of a proteomics approach and reengineering of meso scale network models for prediction of mode-of-action for tyrosine kinase inhibitors

Affiliations

Combination of a proteomics approach and reengineering of meso scale network models for prediction of mode-of-action for tyrosine kinase inhibitors

Stefan Balabanov et al. PLoS One. 2013.

Abstract

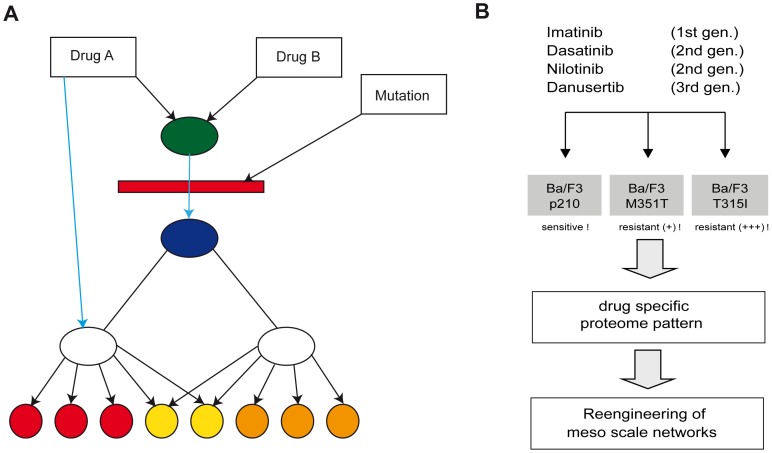
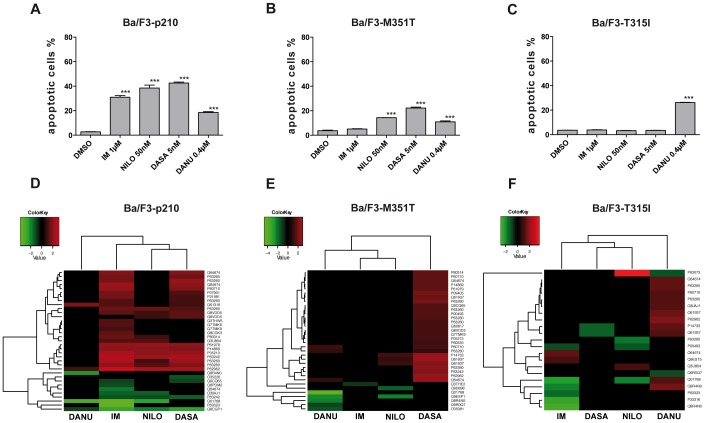
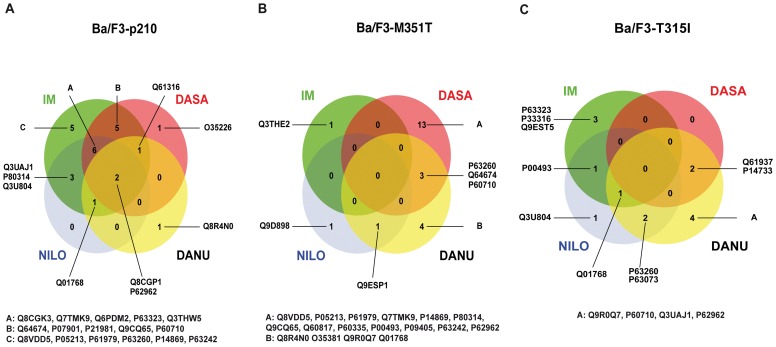
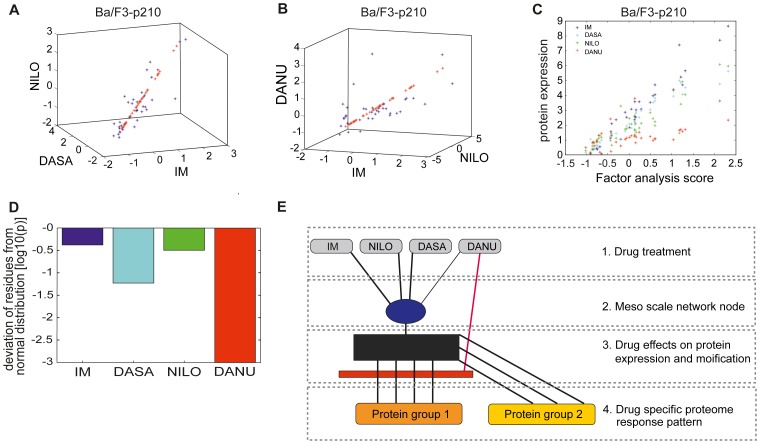
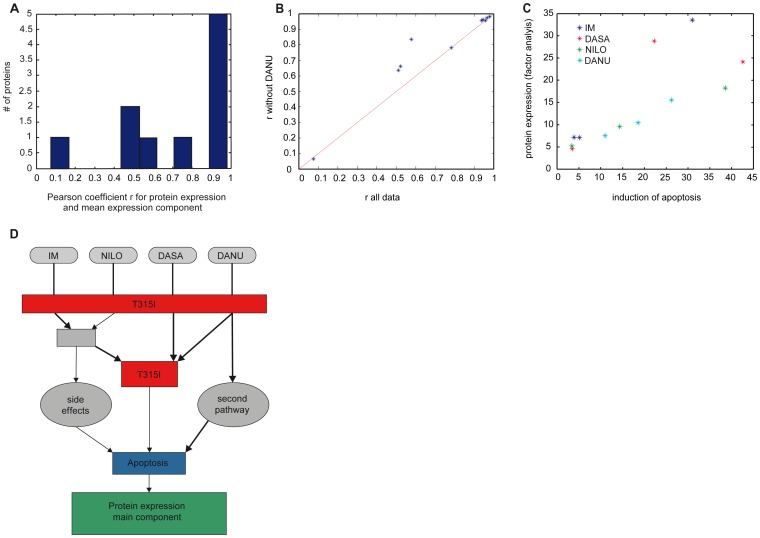
In drug discovery, the characterisation of the precise modes of action (MoA) and of unwanted off-target effects of novel molecularly targeted compounds is of highest relevance. Recent approaches for identification of MoA have employed various techniques for modeling of well defined signaling pathways including structural information, changes in phenotypic behavior of cells and gene expression patterns after drug treatment. However, efficient approaches focusing on proteome wide data for the identification of MoA including interference with mutations are underrepresented. As mutations are key drivers of drug resistance in molecularly targeted tumor therapies, efficient analysis and modeling of downstream effects of mutations on drug MoA is a key to efficient development of improved targeted anti-cancer drugs. Here we present a combination of a global proteome analysis, reengineering of network models and integration of apoptosis data used to infer the mode-of-action of various tyrosine kinase inhibitors (TKIs) in chronic myeloid leukemia (CML) cell lines expressing wild type as well as TKI resistance conferring mutants of BCR-ABL. The inferred network models provide a tool to predict the main MoA of drugs as well as to grouping of drugs with known similar kinase inhibitory activity patterns in comparison to drugs with an additional MoA. We believe that our direct network reconstruction approach, demonstrated on proteomics data, can provide a complementary method to the established network reconstruction approaches for the preclinical modeling of the MoA of various types of targeted drugs in cancer treatment. Hence it may contribute to the more precise prediction of clinically relevant on- and off-target effects of TKIs.


Conflict of interest statement

Competing Interests: THB received research support from Novartis and Bristol-Meyers Squibb. Furthermore THB participated in clinical trials investigating Imatinib, Nilotinib, Dasatinib and Danusertib in CML patients. This does not alter the authors' adherence to all the PLOS ONE policies on sharing data and materials.

Figures

Figure 1
Figure 1. Schematic representation of meso network architecture and experimental design.
(A) Exemplifies an abstract meso-scale network representing (abstract) pathways of drug action of drugs A and B on induction of proteins (red, yellow and orange bullets). Drug A uses two pathways (blue and black), whereas the blue pathway induces expression shifts only on a subset of the proteins (red, yellow), whereas the black pathway induces expression shifts in all proteins. Drug B acts only via one pathway which joins the black pathway of Drug A in an abstract node (represented by the green bullet). The mutation inhibits both pathways between the green and blue bullet resulting in an interference with drug induced expression shift for all proteins. The blue pathway from Drug A to the proteins, however, is not affected by the mutation. Hence the mutation may have a strong impact on the efficacy of drug B, whereas the profile of action of drug A is only altered by the mutation. (B) Imatinib sensitive and resistant cells were treated with four tyrosine kinase inhibitor and mesoscale network were reengineered based on specific proteome expression patterns.
Figure 2
Figure 2. A–F: Apotosis induction after treatment with different TKI and hierarchical clustering of differential expressed protein.
(A) Ba/F3-wt. –p210, -M351T und –T315I cells were incubated with Imatinib (IM), Nilotinib (NILO), Dasatinib (DASA) or Danusertib (DANU) for 24 hours. After 2D-PAGE changes in the protein expression profile was analyzed using Delta-2D software to identify drug-specific. (B–E) Caspase 3 activity in BCR-ABL negative Ba/F3 cells (B), wildtype IM sensitive BCR-ABL positive Ba/F3-p210 cells (C) and mutated IM resistant BCR-ABL positive Ba/F3-M351T-(D) and BAF3/−T315I cells. Asterisks indicate significant changes compared to DMSO. Unsupervised clustering (euclidean distance measure and the 'average' agglomeration method) was performed using the log transformed expression protein values for (D) Ba/F3-p210, (E) Ba/F3-M351T and (F) Ba/F3-T351I cells. The samples are shown horizontally, the proteins vertically. The dendrograms represent the distances between the clusters. In the upper color bar, the upregulated proteins are marked in red, the down regulated are shown in green.
Figure 3
Figure 3. A–C: Venn diagrams for representation of drug specific protein expression.
Venn diagrams illustrated the drug specific effects in different cell lines: (A) Ba/F3-p210, (B) Ba/F3-M351T and (C) Ba/F3-T351I cells. The numbers inside the circles represent the number of regulated proteins.
Figure 4
Figure 4. A–D: Western blot analyses revealed posttranslational modification of eIF5A and up regulation of TGM2 after treatment with IM.
(A) Enlarged regions from a coomassie stained 2D-PAGE from Ba/F3-p210 cells after treatment with IM or DMSO as a control. The arrows indicate two spots for eIF5A, one at pI of 5.2 and the other one at a pI of 6.1. The latter appeared after IM treatment. (B) 2D-WB validated the appearance of a second spot for eIF5A at a pI of 6.2 after IM treatment. (C) Enlarged regions from a coomassie stained 2D-PAGE from Ba/F3-p210 cells after treatment with IM or DMSO as a control. One spot for TGM2 (arrow) demonstrated an increased expression after IM treatment. (D) The increased expression of TGM2 after treatment with rising concentrations of IM could be validated in human Bcr-Abl K562 cells.
Figure 5
Figure 5. A–E: Meso scale networks Ba/F3-p210 cells.
(A) High degree of co-regulation across the protein set for IM, DASA and NILO, which can effectively represented by the mean component of factor analysis. (B) Significant deviations for a small set of proteins for DANU suggesting the use of the more stable factor analysis instead of PCA for reduction of dimension. (C) Analysis quantitatively the amount of induction of protein expression, which is associated with the activation of the dominant mechanisms, quantified by the mean component of factor analysis. Whereas a good and almost similar behaviour for IM, DASA and NILO is observed, DANU activates the proteins in two clearly separated modes (indicated by the upper and lower line of red stars). This finding is supported by quantitatively testing the distribution of the residuals of protein expressions with respect to the linear regression model given by the mean component of factor analysis. (D) Apparently only DANU induces residuals with significant non-gaussian noise indicating the existence of two separate mechanisms of protein induction. (E) Structure of meso scale pathways for induced protein expression. Black block represents induction of the protein expression by the main pathway, whereas the red block is indicating an inhibition via the main pathway.
Figure 6
Figure 6. A–D: Meso scale networks Ba/F3-M351T.
(A) Shows the protein expressions for wt and T351 cell type for all drugs. (B) Shows the sensitivity of protein expression with respect to the dominant activation mechanism, quantified by the mean component of factor analysis. (C) Shows, that surprisingly the overall level of protein expression induced by NILO increases, although the sensitivity decreases. (D) Shows the modifications which are induced by the analysis of the M351I mutation to the meso scale pathway network depicted in Figure 5E. Black block represents induction of the protein expression by the main pathway, whereas the red block is indicating an inhibition via the main pathway. Green block represents the unique effect of NILO on the overall protein expression level.
Figure 7
Figure 7. A–D: Meso scale network models for apoptosis induction.
(A) Distribution of the Pearson coefficient between individual protein expression and the mean component of factor analysis which represents the dominant co-regulation mechanism. (B) Shows that the proteins can be decomposed into two groups differing with respect to the impact of DANU. Most proteins show no different co-regulation behaviour if DANU is omitted from the data set, whereas three proteins show a significantly higher degree of co-regulation (increased r value) when DANU is omitted indicating a second mode of action of DANU. (C) Shows that with exception of two treatments the mean protein expression, represented by the value of the mean component of the factor analysis (y-axis) is correlated to the observed induction of apoptosis (x-axis) indicating a similar efficacy in apoptosis induction for most drugs. The exceptions indicate that protein expression is induced which does not contribute to apoptosis induction. (D) Depicts the meso scale set of pathways, which fits two the observations.

Similar articles

Cited by

References

    1. Sebolt-Leopold JS, English JM (2006) Mechanisms of drug inhibition of signalling molecules. Nature 441: 457–462. - PubMed
    1. Cohen P (2002) Protein kinases [mdash] the major drug targets of the twenty-first century? Nat Rev Drug Discov 1: 309–315. - PubMed
    1. Dancey J, Sausville EA (2003) Issues and progress with protein kinase inhibitors for cancer treatment. Nat Rev Drug Discov 2: 296–313. - PubMed
    1. Bain J, McLauchlan H, Elliott M, Cohen P (2003) The specificities of protein kinase inhibitors: an update. The Biochemical journal 371: 199–204. - PMC - PubMed
    1. Karaman MW, Herrgard S, Treiber DK, Gallant P, Atteridge CE, et al. (2008) A quantitative analysis of kinase inhibitor selectivity. Nat Biotech 26: 127–132. - PubMed

Publication types

MeSH terms