

Ammonium accumulation and cell death in a rat 3D brain cell model of glutaric aciduria type I
- PMID: 23326493
- PMCID: PMC3542363
- DOI: 10.1371/journal.pone.0053735
Ammonium accumulation and cell death in a rat 3D brain cell model of glutaric aciduria type I
Abstract
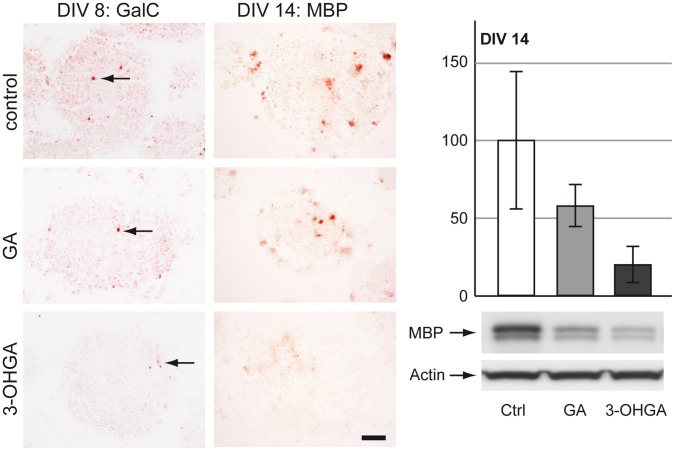
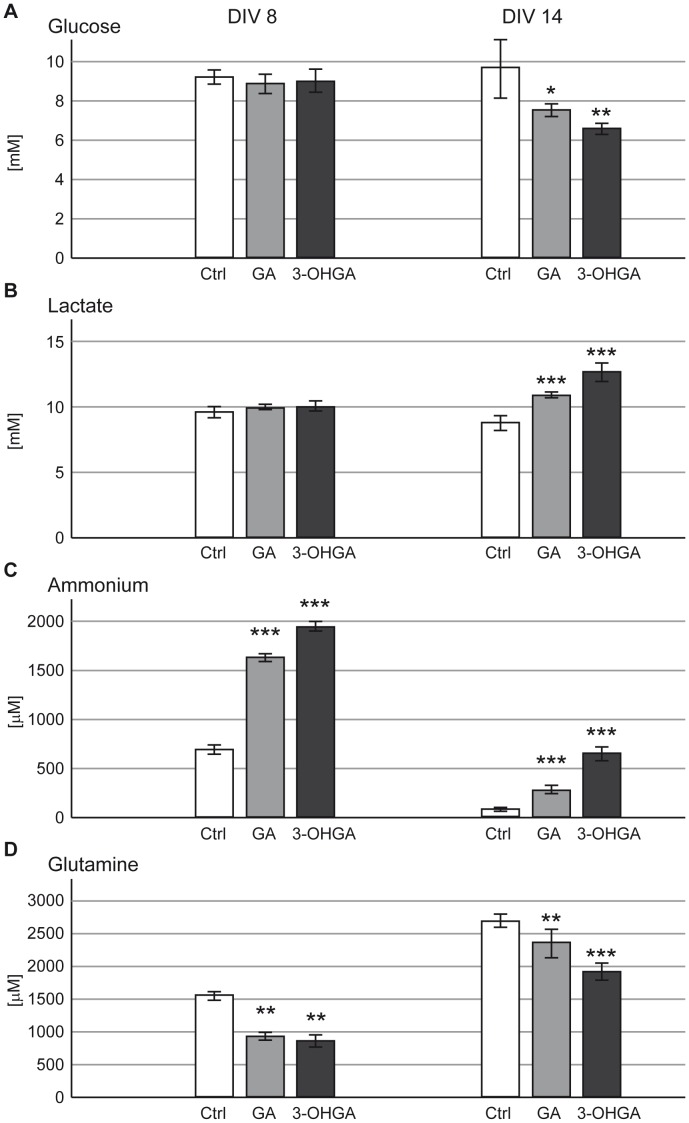
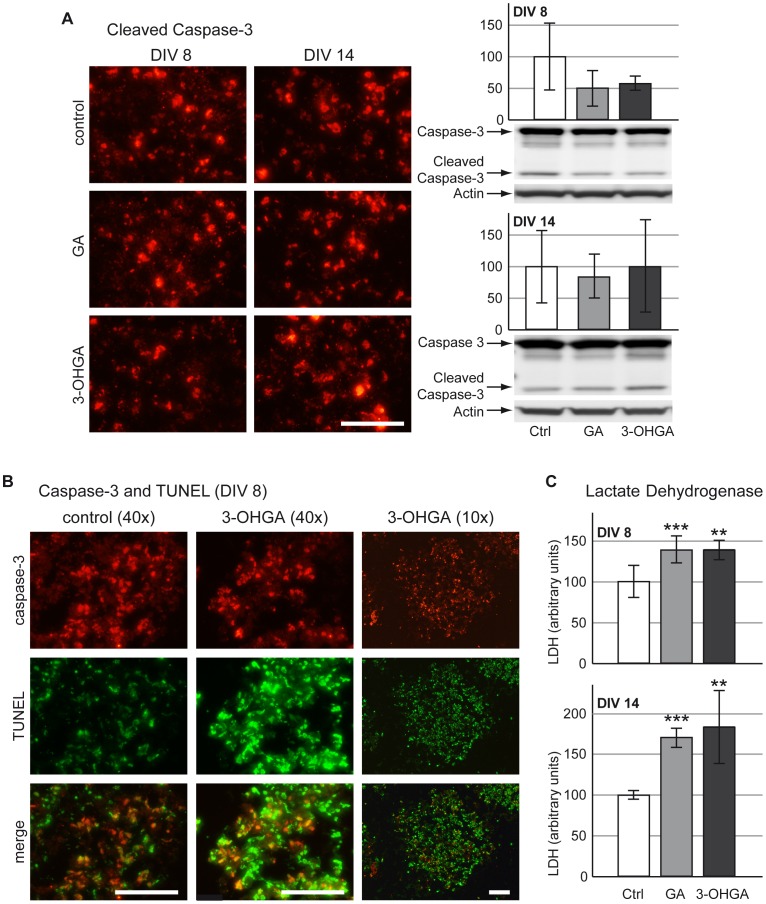
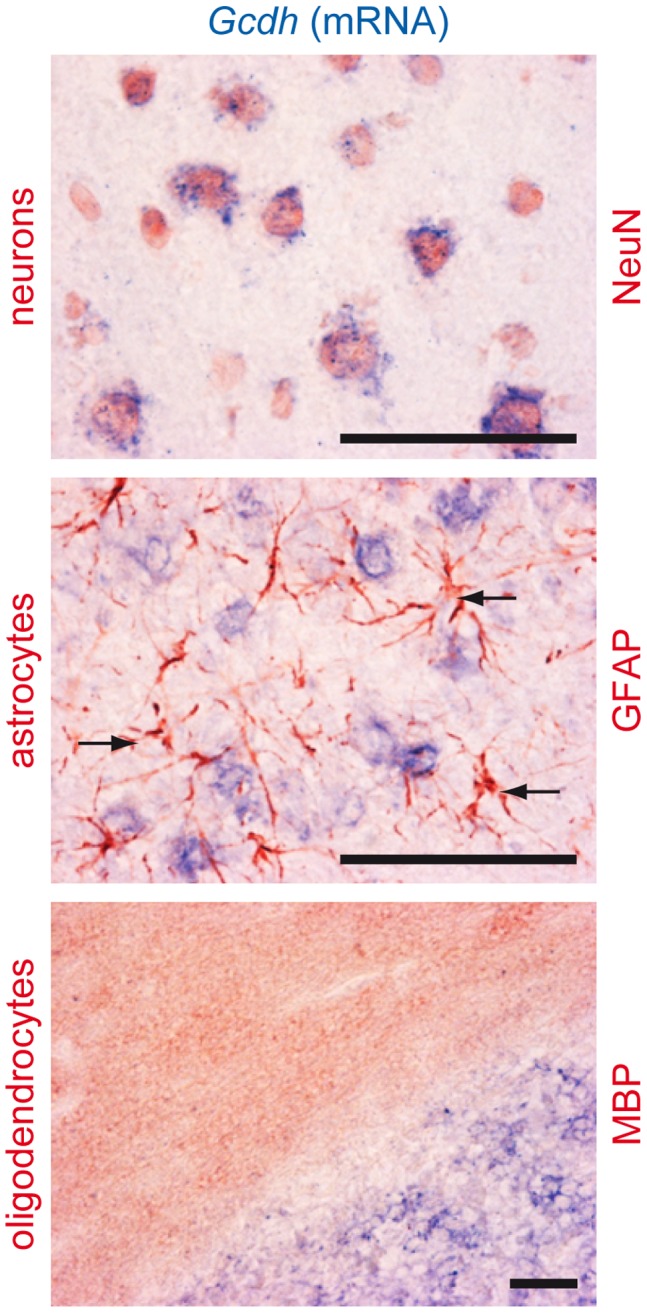
Glutaric aciduria type I (glutaryl-CoA dehydrogenase deficiency) is an inborn error of metabolism that usually manifests in infancy by an acute encephalopathic crisis and often results in permanent motor handicap. Biochemical hallmarks of this disease are elevated levels of glutarate and 3-hydroxyglutarate in blood and urine. The neuropathology of this disease is still poorly understood, as low lysine diet and carnitine supplementation do not always prevent brain damage, even in early-treated patients. We used a 3D in vitro model of rat organotypic brain cell cultures in aggregates to mimic glutaric aciduria type I by repeated administration of 1 mM glutarate or 3-hydroxyglutarate at two time points representing different developmental stages. Both metabolites were deleterious for the developing brain cells, with 3-hydroxyglutarate being the most toxic metabolite in our model. Astrocytes were the cells most strongly affected by metabolite exposure. In culture medium, we observed an up to 11-fold increase of ammonium in the culture medium with a concomitant decrease of glutamine. We further observed an increase in lactate and a concomitant decrease in glucose. Exposure to 3-hydroxyglutarate led to a significantly increased cell death rate. Thus, we propose a three step model for brain damage in glutaric aciduria type I: (i) 3-OHGA causes the death of astrocytes, (ii) deficiency of the astrocytic enzyme glutamine synthetase leads to intracerebral ammonium accumulation, and (iii) high ammonium triggers secondary death of other brain cells. These unexpected findings need to be further investigated and verified in vivo. They suggest that intracerebral ammonium accumulation might be an important target for the development of more effective treatment strategies to prevent brain damage in patients with glutaric aciduria type I.
Conflict of interest statement
Figures
Similar articles
-
Impairment of astrocytic glutaminolysis in glutaric aciduria type I.J Inherit Metab Dis. 2018 Jan;41(1):91-99. doi: 10.1007/s10545-017-0096-5. Epub 2017 Nov 2. J Inherit Metab Dis. 2018. PMID: 29098534
-
The first knock-in rat model for glutaric aciduria type I allows further insights into pathophysiology in brain and periphery.Mol Genet Metab. 2021 Jun;133(2):157-181. doi: 10.1016/j.ymgme.2021.03.017. Epub 2021 Apr 18. Mol Genet Metab. 2021. PMID: 33965309
-
Elevated glutaric acid levels in Dhtkd1-/Gcdh- double knockout mice challenge our current understanding of lysine metabolism.Biochim Biophys Acta Mol Basis Dis. 2017 Sep;1863(9):2220-2228. doi: 10.1016/j.bbadis.2017.05.018. Epub 2017 May 22. Biochim Biophys Acta Mol Basis Dis. 2017. PMID: 28545977
-
The unsolved puzzle of neuropathogenesis in glutaric aciduria type I.Mol Genet Metab. 2011 Dec;104(4):425-37. doi: 10.1016/j.ymgme.2011.08.027. Epub 2011 Sep 2. Mol Genet Metab. 2011. PMID: 21944461 Review.
-
A role of astrocytes in mediating postnatal neurodegeneration in Glutaric acidemia-type 1.FEBS Lett. 2015 Nov 14;589(22):3492-7. doi: 10.1016/j.febslet.2015.09.010. Epub 2015 Sep 26. FEBS Lett. 2015. PMID: 26409499 Review.
Cited by
-
White matter injury induced by perinatal exposure to glutaric acid.Neurotox Res. 2014 May;25(4):381-91. doi: 10.1007/s12640-013-9445-9. Epub 2013 Dec 3. Neurotox Res. 2014. PMID: 24297153
-
Increased blood-brain barrier permeability and alterations in perivascular astrocytes and pericytes induced by intracisternal glutaric acid.Fluids Barriers CNS. 2014 Jul 24;11:15. doi: 10.1186/2045-8118-11-15. eCollection 2014. Fluids Barriers CNS. 2014. PMID: 25077029 Free PMC article.
-
Induction of Neuroinflammatory Response and Histopathological Alterations Caused by Quinolinic Acid Administration in the Striatum of Glutaryl-CoA Dehydrogenase Deficient Mice.Neurotox Res. 2018 Apr;33(3):593-606. doi: 10.1007/s12640-017-9848-0. Epub 2017 Dec 12. Neurotox Res. 2018. PMID: 29235064
-
Cerebral White Matter Alterations Associated With Oligodendrocyte Vulnerability in Organic Acidurias: Insights in Glutaric Aciduria Type I.Neurotox Res. 2024 Jul 4;42(4):33. doi: 10.1007/s12640-024-00710-6. Neurotox Res. 2024. PMID: 38963434 Review.
-
Impairment of astrocytic glutaminolysis in glutaric aciduria type I.J Inherit Metab Dis. 2018 Jan;41(1):91-99. doi: 10.1007/s10545-017-0096-5. Epub 2017 Nov 2. J Inherit Metab Dis. 2018. PMID: 29098534
References
-
- Sauer SW, Okun JG, Fricker G, Mahringer A, Muller I, et al. (2006) Intracerebral accumulation of glutaric and 3-hydroxyglutaric acids secondary to limited flux across the blood-brain barrier constitute a biochemical risk factor for neurodegeneration in glutaryl-CoA dehydrogenase deficiency. Journal of neurochemistry 97: 899–910. - PubMed
-
- Strauss KA, Morton DH (2003) Type I glutaric aciduria, part 2: a model of acute striatal necrosis. American journal of medical genetics Part C, Seminars in medical genetics 121C: 53–70. - PubMed
-
- Strauss KA, Puffenberger EG, Robinson DL, Morton DH (2003) Type I glutaric aciduria, part 1: natural history of 77 patients. American journal of medical genetics Part C, Seminars in medical genetics 121C: 38–52. - PubMed
-
- Hoffmann GF, Meier-Augenstein W, Stöckler S, Surtees R, Rating D, et al. (1993) Physiology and pathophysiology of organic acids in cerebrospinal fluid. Journal of inherited metabolic disease 16: 648–669. - PubMed
Publication types
MeSH terms
Substances
Supplementary concepts
LinkOut - more resources
Full Text Sources
Other Literature Sources
Medical
