

Parallel analysis of mRNA and microRNA microarray profiles to explore functional regulatory patterns in polycystic kidney disease: using PKD/Mhm rat model
- PMID: 23326503
- PMCID: PMC3542345
- DOI: 10.1371/journal.pone.0053780
Parallel analysis of mRNA and microRNA microarray profiles to explore functional regulatory patterns in polycystic kidney disease: using PKD/Mhm rat model
Abstract
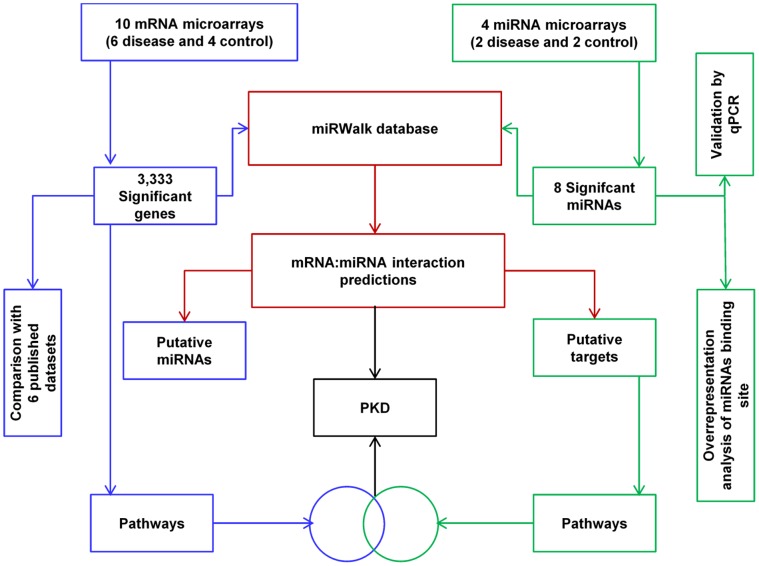
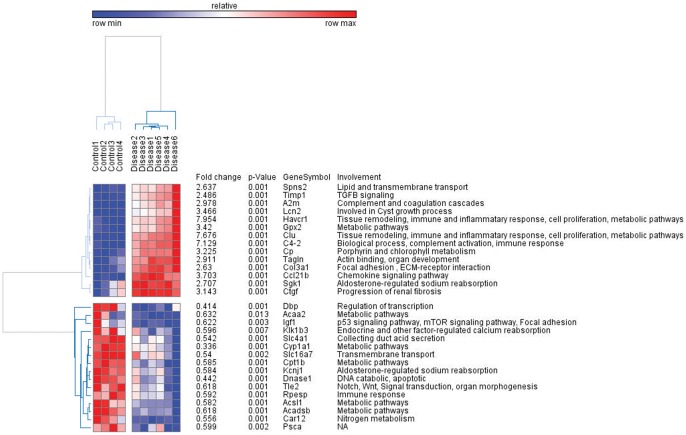
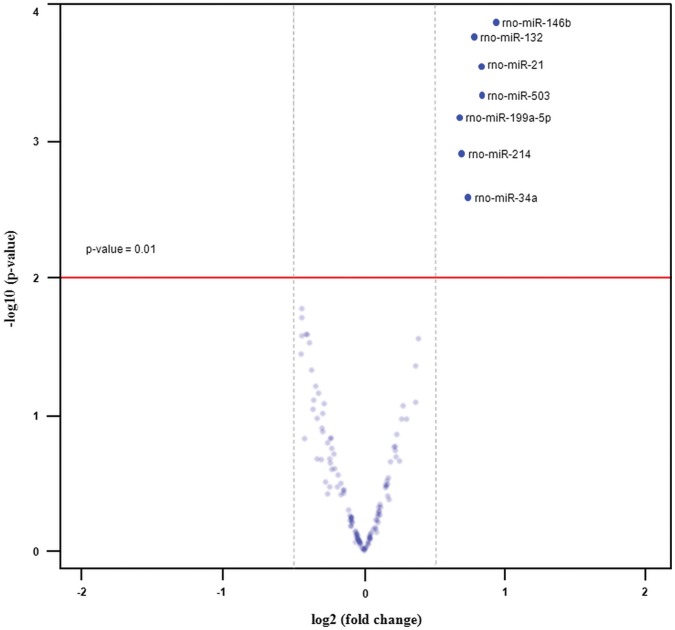
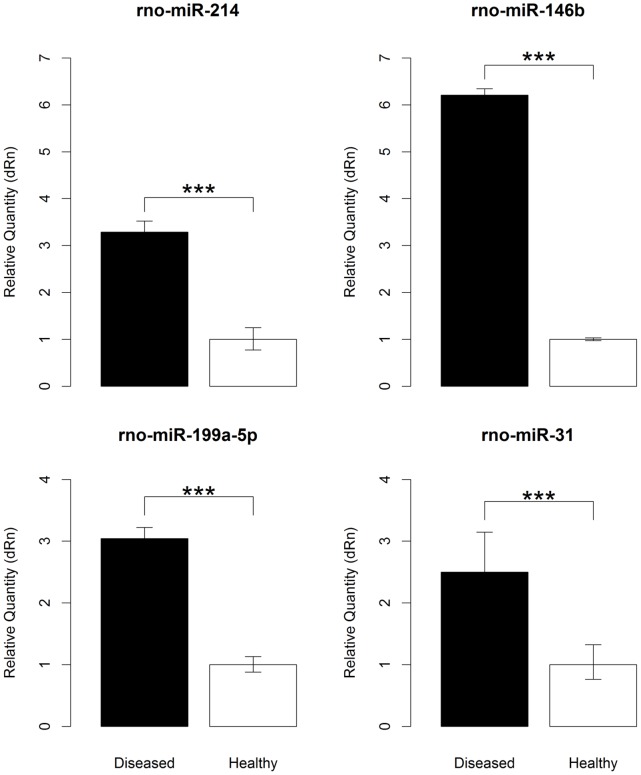
Autosomal polycystic kidney disease (ADPKD) is a frequent monogenic renal disease, characterised by fluid-filled cysts that are thought to result from multiple deregulated pathways such as cell proliferation and apoptosis. MicroRNAs (miRNAs) are small non-coding RNAs that regulate the expression of many genes associated with such biological processes and human pathologies. To explore the possible regulatory role of miRNAs in PKD, the PKD/Mhm (cy/+) rat, served as a model to study human ADPKD. A parallel microarray-based approach was conducted to profile the expression changes of mRNAs and miRNAs in PKD/Mhm rats. 1,573 up- and 1,760 down-regulated genes were differentially expressed in PKD/Mhm. These genes are associated with 17 pathways (such as focal adhesion, cell cycle, ECM-receptor interaction, DNA replication and metabolic pathways) and 47 (e.g., cell proliferation, Wnt and Tgfβ signaling) Gene Ontologies. Furthermore, we found the similar expression patterns of deregulated genes between PKD/Mhm (cy/+) rat and human ADPKD, PKD1(L3/L3), PKD1(-/-), Hnf1α-deficient, and Glis2(lacZ/lacZ) models. Additionally, several differentially regulated genes were noted to be target hubs for miRNAs. We also obtained 8 significantly up-regulated miRNAs (rno-miR-199a-5p, -214, -146b, -21, -34a, -132, -31 and -503) in diseased kidneys of PKD/Mhm rats. Additionally, the binding site overrepresentation and pathway enrichment analyses were accomplished on the putative targets of these 8 miRNAs. 7 out of these 8 miRNAs and their possible interactions have not been previously described in ADPKD. We have shown a strong overlap of functional patterns (pathways) between deregulated miRNAs and mRNAs in the PKD/Mhm (cy/+) rat model. Our findings suggest that several miRNAs may be associated in regulating pathways in ADPKD. We further describe novel miRNAs and their possible targets in ADPKD, which will open new avenues to understand the pathogenesis of human ADPKD. Furthermore they could serve as a useful resource for anti-fibrotic therapeutics.
Conflict of interest statement
Figures
Similar articles
-
Systems biology approach to identify transcriptome reprogramming and candidate microRNA targets during the progression of polycystic kidney disease.BMC Syst Biol. 2011 Apr 25;5:56. doi: 10.1186/1752-0509-5-56. BMC Syst Biol. 2011. PMID: 21518438 Free PMC article.
-
Inhibition of Comt with tolcapone slows progression of polycystic kidney disease in the more severely affected PKD/Mhm (cy/+) substrain of the Hannover Sprague-Dawley rat.Nephrol Dial Transplant. 2013 Aug;28(8):2045-58. doi: 10.1093/ndt/gft014. Epub 2013 Mar 29. Nephrol Dial Transplant. 2013. PMID: 23543593 Free PMC article.
-
Microarray-based approach identifies microRNAs and their target functional patterns in polycystic kidney disease.BMC Genomics. 2008 Dec 23;9:624. doi: 10.1186/1471-2164-9-624. BMC Genomics. 2008. PMID: 19102782 Free PMC article.
-
Modulation of polycystic kidney disease by non-coding RNAs.Cell Signal. 2020 Jul;71:109548. doi: 10.1016/j.cellsig.2020.109548. Epub 2020 Jan 23. Cell Signal. 2020. PMID: 31982550 Free PMC article. Review.
-
The master regulators Myc and p53 cellular signaling and functions in polycystic kidney disease.Cell Signal. 2020 Jul;71:109594. doi: 10.1016/j.cellsig.2020.109594. Epub 2020 Mar 4. Cell Signal. 2020. PMID: 32145315 Review.
Cited by
-
Molecular pathways and therapies in autosomal-dominant polycystic kidney disease.Physiology (Bethesda). 2015 May;30(3):195-207. doi: 10.1152/physiol.00032.2014. Physiology (Bethesda). 2015. PMID: 25933820 Free PMC article. Review.
-
The Role of MicroRNAs in Kidney Disease.Noncoding RNA. 2015 Nov 18;1(3):192-221. doi: 10.3390/ncrna1030192. Noncoding RNA. 2015. PMID: 29861424 Free PMC article. Review.
-
Identification of ADPKD-Related Genes and Pathways in Cells Overexpressing PKD2.Genes (Basel). 2020 Jan 22;11(2):122. doi: 10.3390/genes11020122. Genes (Basel). 2020. PMID: 31979107 Free PMC article.
-
MicroRNAs and Polycystic Kidney Disease.Kidney Med. 2020 Sep 21;2(6):762-770. doi: 10.1016/j.xkme.2020.06.013. eCollection 2020 Nov-Dec. Kidney Med. 2020. PMID: 33319200 Free PMC article. Review.
-
Non-coding RNAs as potential biomarkers and therapeutic targets in polycystic kidney disease.Front Physiol. 2022 Sep 20;13:1006427. doi: 10.3389/fphys.2022.1006427. eCollection 2022. Front Physiol. 2022. PMID: 36203940 Free PMC article. Review.
References
-
- Bartel DP (2004) MicroRNAs: genomics, biogenesis, mechanism, and function. Cell 116: 281–297. - PubMed
-
- Ambros V (2004) The functions of animal microRNAs. Nature 431: 350–355. - PubMed
-
- Croce CM, Calin GA (2005) miRNAs, cancer, and stem cell division. Cell 122: 6–7. - PubMed
-
- Esquela-Kerscher A, Trang P, Wiggins JF, Patrawala L, Cheng A, et al. (2008) The let-7 microRNA reduces tumor growth in mouse models of lung cancer. Cell Cycle 7: 759–764. - PubMed
Publication types
MeSH terms
Substances
LinkOut - more resources
Full Text Sources
Other Literature Sources
