. 2013;8(1):e53803.
doi: 10.1371/journal.pone.0053803. Epub 2013 Jan 10.

Downregulation of the mitochondrial phosphatase PTPMT1 is sufficient to promote cancer cell death

Affiliations

Downregulation of the mitochondrial phosphatase PTPMT1 is sufficient to promote cancer cell death

Natalie M Niemi et al. PLoS One. 2013.

Abstract

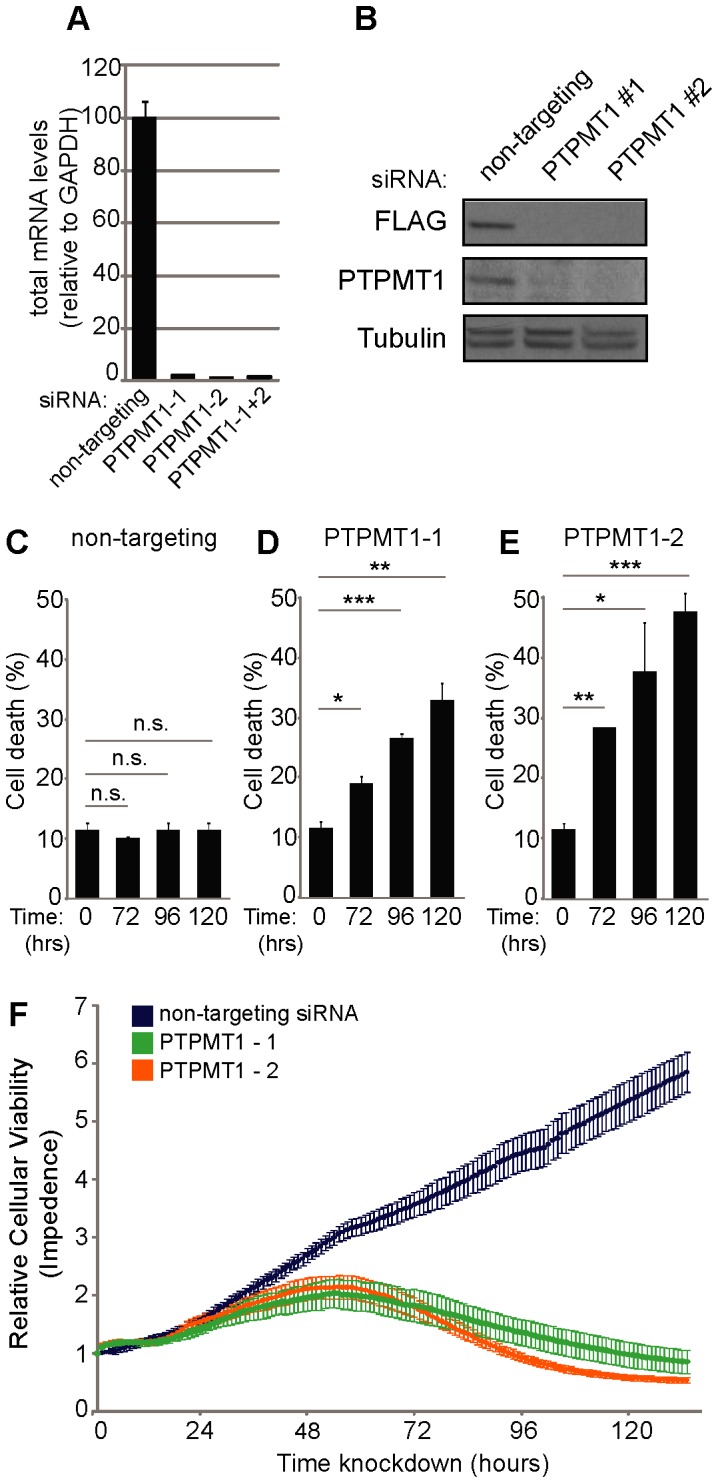
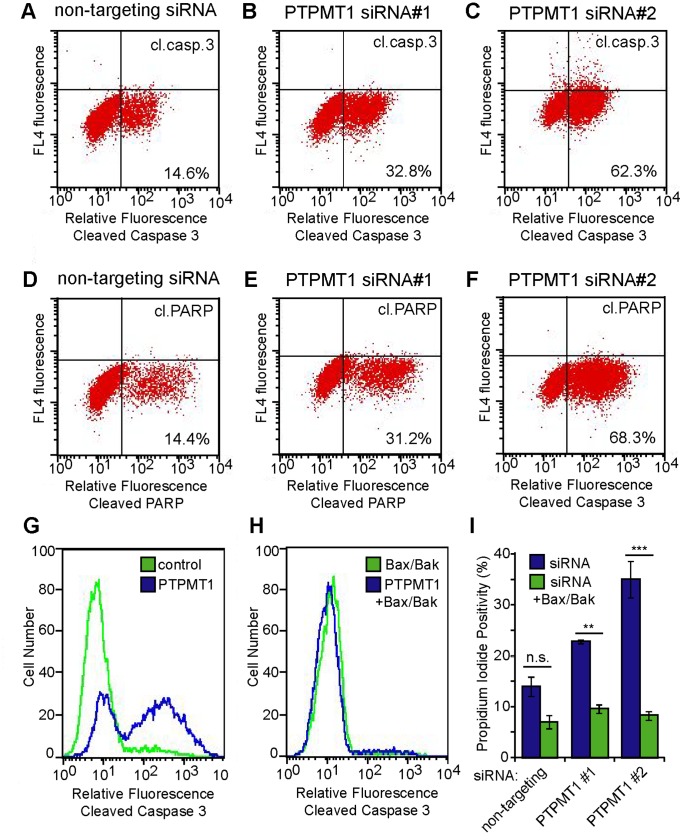
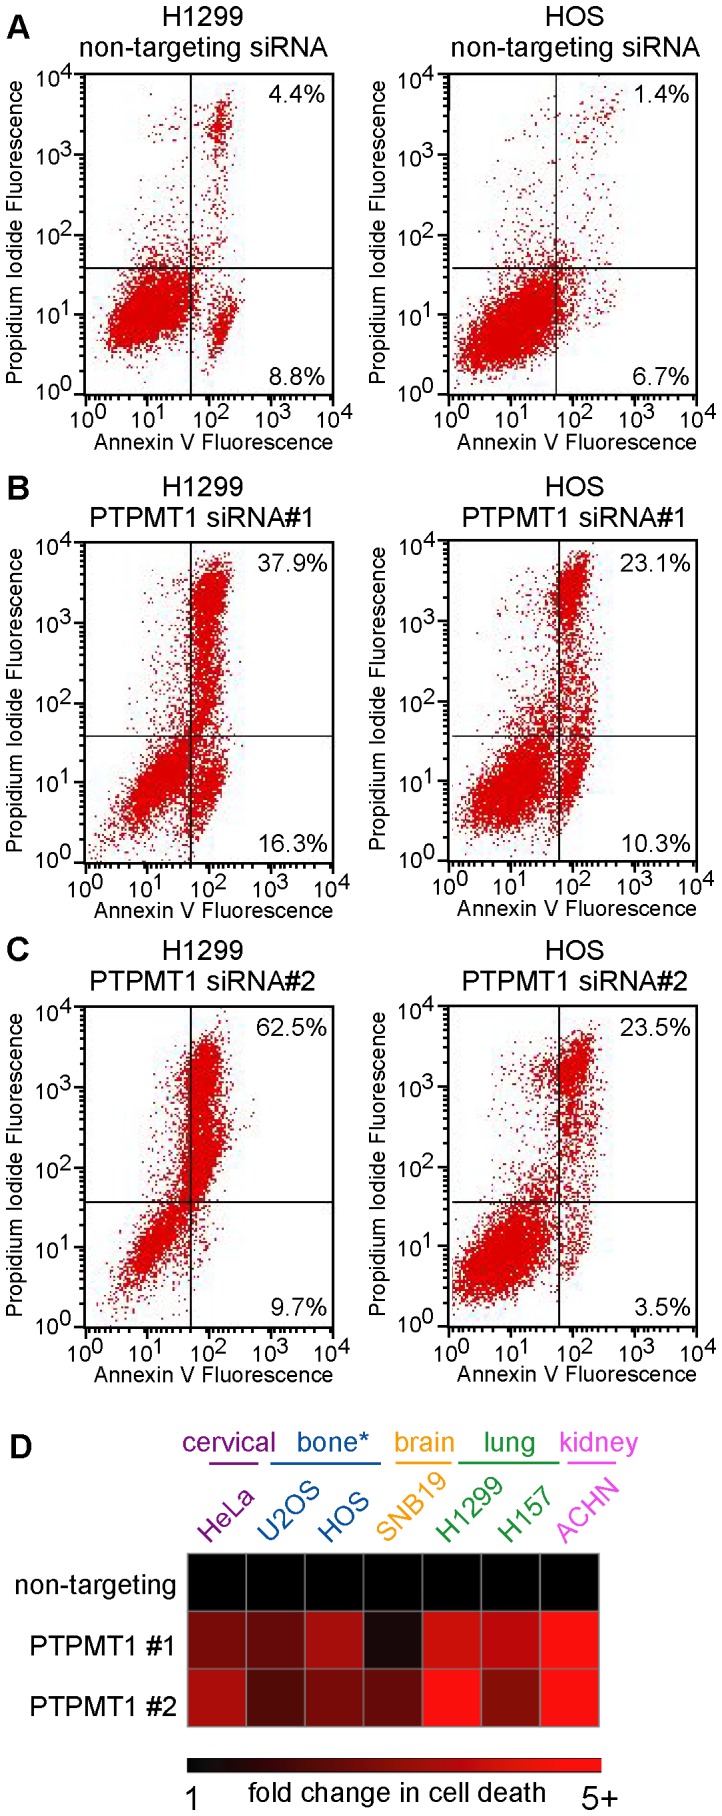
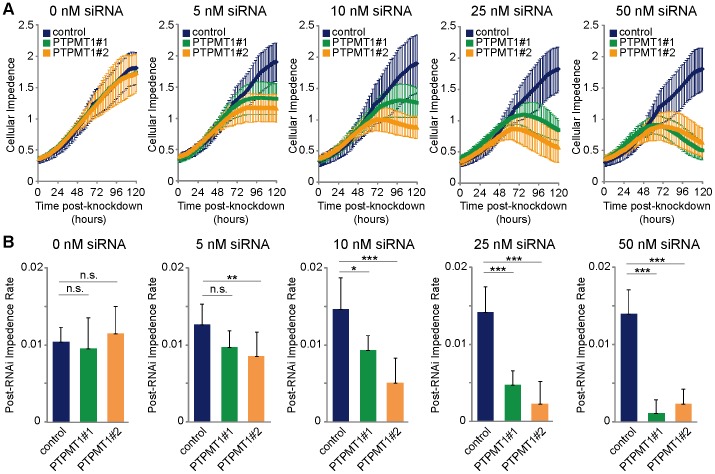
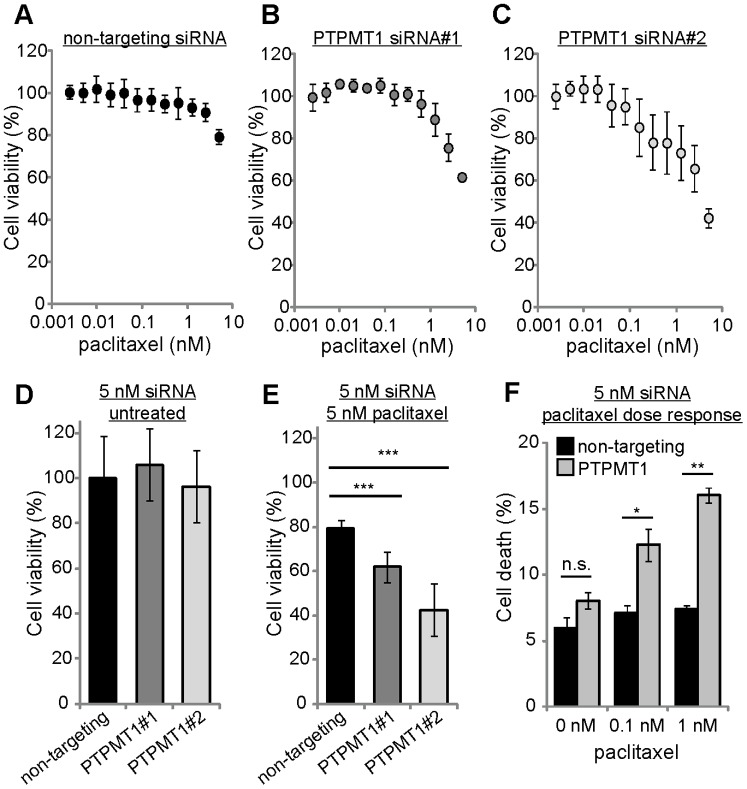
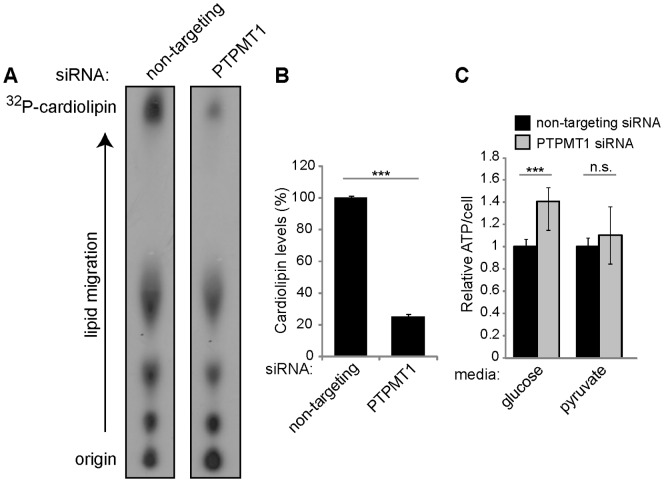
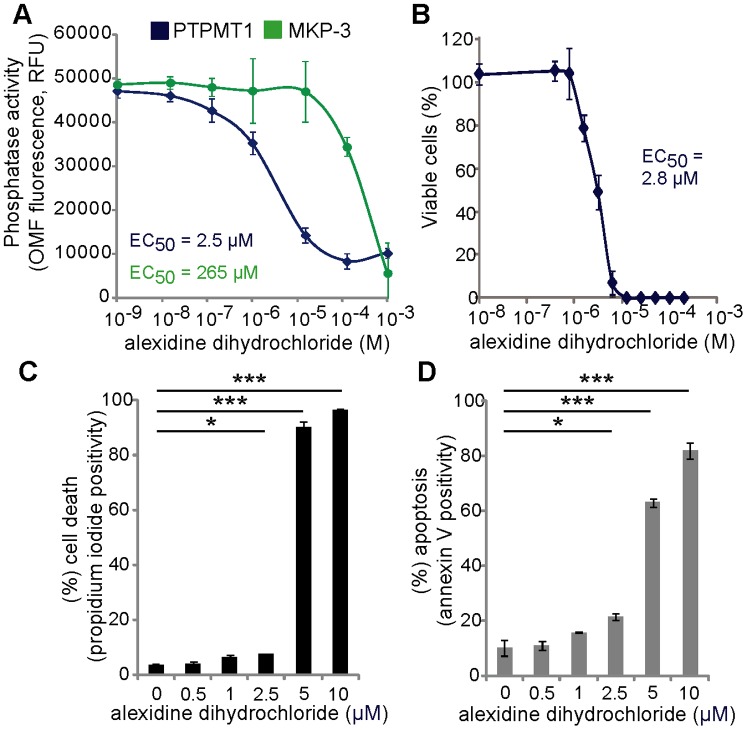
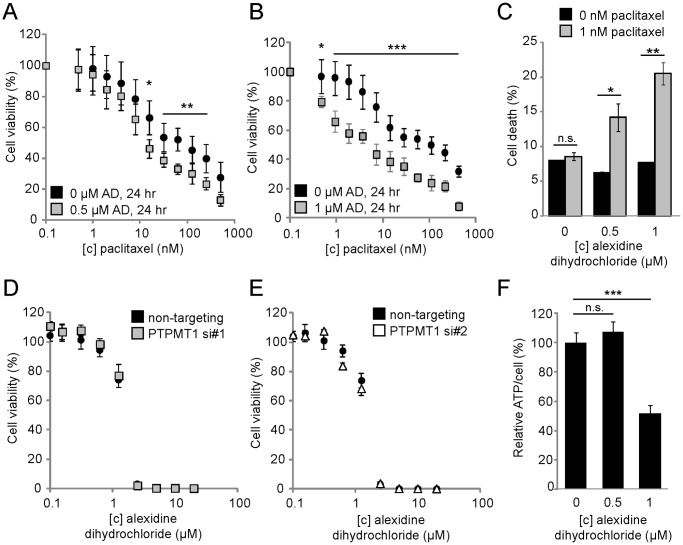
Protein Tyrosine Phosphatase localized to the Mitochondrion 1 (PTPMT1) is a dual specificity phosphatase exclusively localized to the mitochondria, and has recently been shown to be a critical component in the cardiolipin biosynthetic pathway. The downregulation of PTPMT1 in pancreatic beta cells has been shown to increase cellular ATP levels and insulin production, however, the generalized role of PTPMT1 in cancer cells has not been characterized. Here we report that downregulation of PTPMT1 activity is sufficient to induce apoptosis of cancer cells. Additionally, the silencing of PTPMT1 decreases cardiolipin levels in cancer cells, while selectively increasing ATP levels in glycolytic media. Additionally, sublethal downregulation of PTPMT1 synergizes with low doses of paclitaxel to promote cancer cell death. Our data suggest that inhibition of PTPMT1 causes a metabolic crisis in cancer cells that induces cell death, and may be a mechanism by which cancer cells can be sensitized to currently available therapies.


Conflict of interest statement

Competing Interests: The authors have declared that no competing interests exist.

Figures

Figure 1
Figure 1. RNAi-mediated downregulation of PTPMT1 induces cell death in HeLa cells.
(A) Quantitative RT-PCR analysis of PTPMT1 mRNA levels in HeLa cells after knockdown with two non-overlapping PTPMT1-specfic siRNAs or a non-targeting control. (B) HeLa cells were transfected with two PTPMT1 siRNAs or a non-targeting control for 48 hr. In one experiment, PTPMT1 was overexpressed (with a FLAG-tag) for 20 hr (total siRNA transfection time 48 hr) and expression was probed with a FLAG antibody (top panel). siRNA knock down was also determined for endogenous PTPMT1 (middle panel). Tubulin (bottom panel) demonstrates equal loading of protein lysates in all lanes. (C–E) HeLa cells were transfected with control or PTPMT1 siRNAs and collected after indicated times, at which cell death was assayed by propidium iodide exclusion. Error bars indicate standard deviation of three experiments. Statistical significance was calculated using a student’s t test; * - p<0.05; ** - p<0.01; *** - p<0.001. (F) HeLa cells were transfected with control or PTPMT1 siRNAs and assayed for viability in real time (>120 hours) using the xCELLigence system.
Figure 2
Figure 2. PTPMT1 knockdown induces mitochondrial-dependent apoptosis.
(A–F) HeLa cells were transfected with control non-targeting siRNA (A, D), PTPMT1 siRNA#1 (B, E), or PTPMT1 siRNA#2 (C, F) for 96 hours. Cells were collected and stained for cleaved caspase-3 (top panels) or cleaved PARP (bottom panels) under each condition, with positivity indicated as an increase in fluorescence on the FACS histogram (lower right quadrant). (G–I) HeLa cells were transfected with control, PTPMT1, and/or BAX/BAK siRNAs for 96 hours. Cells were collected and stained for cleaved caspase-3 (G, H) or propidium iodide positivity (I). Error bars indicate standard deviation of three experiments. Statistical significance was calculated using a student’s t test; * - p<0.05; ** - p<0.01; *** - p<0.001.
Figure 3
Figure 3. PTPMT1 knockdown induces apoptosis in many cancer cell lines.
(A–C) The lung carcinoma cell line H1299 and the osteosarcoma cell line HOS were transfected with non-targeting (A), PTPMT1 siRNA#1 (B) or PTPMT1 siRNA#2 (C). After transfection of these siRNAs for 120 hours, the population of cells undergoing cell death and apoptosis was measured through propidium iodide positivity (y-axis) and Annexin V positivity (x-axis). (D) A panel of highly transfectable cell lines derived from many tissue types (see colored labels above heatmap) were transfected with non-targeting or PTPMT1 siRNAs. Cell death and apoptosis were assayed by propidium iodide and Annexin V positivity as in (A–C). Fold change in apoptosis was determined by normalizing percent cell death seen in cells transfected with a non-targeting control to 1, with fold change reflecting the amount of cell death above this threshold in PTPMT1 knockdown cells. The heatmap shows a range of fold change from 1 (black squares) to 5+ (five or greater fold, red squared).
Figure 4
Figure 4. Differential PTPMT1 knockdown alters the absolute level of HeLa cell apoptosis.
(A) HeLa cells were transfected with a dose response of non-targeting (blue line), PTPMT1#1 (green line) or PTPMT1#2 (orange line) siRNA over 120 hours. Cells were transfected with 0, 5, 10, 25, or 50 nM of each siRNA and real-time viability was tracked using xCELLigence. (B) Rate of change in cellular impedance, reflecting changes in proliferation (positive slope) and/or viability (negative slope) in cells transfected with control or PTPMT1 siRNAs. A lower rate of change in impedance is associated with decreased cellular attachment, indicative of cell death. Error bars indicate standard deviation of three experiments. Statistical significance was calculated using a student’s t test; * - p<0.05; ** - p<0.01; *** - p<0.001.
Figure 5
Figure 5. Sublethal PTPMT1 knockdown sensitizes cells to the chemotherapeutic paclitaxel.
(A–C) HeLa cells were transfected with 5 nM non-targeting siRNA (A), PTPMT1 siRNA#1 (B), or PTPMT1 siRNA#2 (C) for 30 hours before treatment with a dose response of sublethal paclitaxel (up to 5 nM) for 24 hours. Viability was measured using Cell Titer Glo. (D) Viability of untreated HeLa cells transfected with each siRNA at 54 hours. (E, F) Quantification of HeLa cell viability (E) or HeLa cell death by propidium iodide exclusion (F) with 5 nM non-targeting or PTPMT1 siRNA (54 hr total treatment) and 5 nM paclitaxel treatment (24 hr total treatment). For each experiment, error bars indicate standard deviation of three experiments. Statistical significance was calculated using a student’s t test; * - p<0.05; ** - p<0.01; *** - p<0.001.
Figure 6
Figure 6. PTPMT1 knockdown alters cardiolipin levels and total ATP/cell in cancer cells.
(A, B) HeLa cells were transfected with non-targeting or a pool of PTPMT1 siRNAs (#1+ #2) for 72 hours. Cells were incubated with 32P-orthophosphate and radiolabeled lipids were extracted and resolved via thin layer chromatography. Cardiolipin is shown as the highest spot imaged on the TLC plates (A), and total cardiolipin levels were quantified (B). (C) Total ATP/cell was assayed in cells transfected with a non-targeting or PTPMT1 pool of siRNAs for 72 hours. ATP/cell was determined in cells growing in both high glucose-containing media or media containing only pyruvate. Error bars indicate standard deviation of at least three experiments. Statistical significance was calculated using a student’s t test; * - p<0.05; ** - p<0.01; *** - p<0.001.
Figure 7
Figure 7. Alexidine dihydrochloride specifically inhibits PTPMT1 and induces cell death.
(A) Recombinant PTPMT1 and MKP-3 were treated with various concentrations of alexidine dihydrochloride, in vitro phosphatase assays were performed, and the resulting effects on enzymatic activity measured. The IC50 for each enzyme was calculated and displayed using SigmaPlot. (B) HeLa cells were treated with a dose response of alexidine dihydrochloride for 24 hours and resulting changes in viability were measured using Cell Titer Glo. (C, D) HeLa cells were treated with alexidine dihydrochloride for 24 hours before measuring cell death (C) by propidium iodide staining (C) or induction of apoptosis by Annexin V staining (D). For each experiment, error bars indicate standard deviation of three experiments. Statistical significance was calculated using a student’s t test; * - p<0.05; ** - p<0.01; *** - p<0.001.
Figure 8
Figure 8. Sublethal doses of alexidine dihydrochloride are sufficient to sensitize HeLa cells to the chemotherapeutic paclitaxel but are independent of PTPMT1 expression.
(A, B) HeLa cells were treated with 0.5 µM (A) or 1 µM (B) alexidine dihydrochloride, or a vehicle only control (DMSO, 0 µM condition, (A, B)) for 24 hours. Cells were then exposed to a dose response of paclitaxel for an additional 48 hours. Changes in viability were measured using Cell Titer Glo. (C) HeLa cells were treated with 0.5 µM or 1 µM alexidine dihydrochloride for 24 hrs before being exposed to 1 nM paclitaxel for an additional 24 hrs. Cell death was assayed by propidium iodide positivity. (D, E) HeLa cells were transfected with non-targeting siRNA (black circles), PTPMT1 siRNA#1 (grey squares), or PTPMT1 siRNA#2 (white triangles) for 30 hours before being exposed to a dose response of alexidine dihydrochloride for 24 hours. Viability was assayed using Cell Titer Glo. (F) Total ATP/cell was assayed in cells treated with alexidine dihydrochloride for 24 hrs. For each experiment, error bars indicate standard deviation of three experiments. Statistical significance was calculated using a student’s t test; * - p<0.05; ** - p<0.01; *** - p<0.001.

Similar articles

Cited by

References

    1. Guan KL, Xiong Y (2011) Regulation of intermediary metabolism by protein acetylation. Trends Biochem Sci 36: 108–116. - PMC - PubMed
    1. Soubannier V, McBride HM (2009) Positioning mitochondrial plasticity within cellular signaling cascades. Biochim Biophys Acta 1793: 154–170. - PubMed
    1. Taylor EB, Rutter J (2011) Mitochondrial quality control by the ubiquitin-proteasome system. Biochem Soc Trans 39: 1509–1513. - PubMed
    1. Willers IM, Cuezva JM (2011) Post-transcriptional regulation of the mitochondrial H(+)-ATP synthase: a key regulator of the metabolic phenotype in cancer. Biochim Biophys Acta 1807: 543–551. - PubMed
    1. Pagliarini DJ, Dixon JE (2006) Mitochondrial modulation: reversible phosphorylation takes center stage? Trends Biochem Sci 31: 26–34. - PubMed

Publication types

MeSH terms