Hydrogen improves glycemic control in type1 diabetic animal model by promoting glucose uptake into skeletal muscle
- PMID: 23326534
- PMCID: PMC3542317
- DOI: 10.1371/journal.pone.0053913
Hydrogen improves glycemic control in type1 diabetic animal model by promoting glucose uptake into skeletal muscle
Erratum in
- PLoS One. 2013;8(4). doi: 10.1371/annotation/ea26285b-dda3-470d-a8df-241df9fbc5ad
Abstract
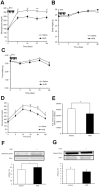
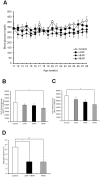
Hydrogen (H(2)) acts as a therapeutic antioxidant. However, there are few reports on H(2) function in other capacities in diabetes mellitus (DM). Therefore, in this study, we investigated the role of H(2) in glucose transport by studying cultured mouse C2C12 cells and human hepatoma Hep-G2 cells in vitro, in addition to three types of diabetic mice [Streptozotocin (STZ)-induced type 1 diabetic mice, high-fat diet-induced type 2 diabetic mice, and genetically diabetic db/db mice] in vivo. The results show that H(2) promoted 2-[(14)C]-deoxy-d-glucose (2-DG) uptake into C2C12 cells via the translocation of glucose transporter Glut4 through activation of phosphatidylinositol-3-OH kinase (PI3K), protein kinase C (PKC), and AMP-activated protein kinase (AMPK), although it did not stimulate the translocation of Glut2 in Hep G2 cells. H(2) significantly increased skeletal muscle membrane Glut4 expression and markedly improved glycemic control in STZ-induced type 1 diabetic mice after chronic intraperitoneal (i.p.) and oral (p.o.) administration. However, long-term p.o. administration of H(2) had least effect on the obese and non-insulin-dependent type 2 diabetes mouse models. Our study demonstrates that H(2) exerts metabolic effects similar to those of insulin and may be a novel therapeutic alternative to insulin in type 1 diabetes mellitus that can be administered orally.
Conflict of interest statement
Figures


Similar articles
-
Antihyperglycaemic activity of 2,4:3,5-dibenzylidene-D-xylose-diethyl dithioacetal in diabetic mice.J Cell Mol Med. 2012 Mar;16(3):594-604. doi: 10.1111/j.1582-4934.2011.01340.x. J Cell Mol Med. 2012. PMID: 21564514 Free PMC article.
-
Pancreastatin inhibitor PSTi8 protects the obesity associated skeletal muscle insulin resistance in diet induced streptozotocin-treated diabetic mice.Eur J Pharmacol. 2020 Aug 15;881:173204. doi: 10.1016/j.ejphar.2020.173204. Epub 2020 May 19. Eur J Pharmacol. 2020. PMID: 32439261
-
Gallic acid attenuates high-fat diet fed-streptozotocin-induced insulin resistance via partial agonism of PPARγ in experimental type 2 diabetic rats and enhances glucose uptake through translocation and activation of GLUT4 in PI3K/p-Akt signaling pathway.Eur J Pharmacol. 2014 Dec 15;745:201-16. doi: 10.1016/j.ejphar.2014.10.044. Epub 2014 Nov 5. Eur J Pharmacol. 2014. PMID: 25445038
-
Treatment of diabetes with vanadium salts: general overview and amelioration of nutritionally induced diabetes in the Psammomys obesus gerbil.Diabetes Metab Res Rev. 2001 Jan-Feb;17(1):55-66. doi: 10.1002/1520-7560(2000)9999:9999<::aid-dmrr165>3.0.co;2-j. Diabetes Metab Res Rev. 2001. PMID: 11241892 Review.
-
Cellular and physiological effects of C-peptide.Clin Sci (Lond). 2009 Apr;116(7):565-74. doi: 10.1042/CS20080441. Clin Sci (Lond). 2009. PMID: 19243312 Review.
Cited by
-
The Effects of 24-Week, High-Concentration Hydrogen-Rich Water on Body Composition, Blood Lipid Profiles and Inflammation Biomarkers in Men and Women with Metabolic Syndrome: A Randomized Controlled Trial.Diabetes Metab Syndr Obes. 2020 Mar 24;13:889-896. doi: 10.2147/DMSO.S240122. eCollection 2020. Diabetes Metab Syndr Obes. 2020. PMID: 32273740 Free PMC article.
-
Does H2 Alter Mitochondrial Bioenergetics via GHS-R1α Activation?Theranostics. 2017 Mar 7;7(5):1330-1332. doi: 10.7150/thno.18745. eCollection 2017. Theranostics. 2017. PMID: 28435468 Free PMC article.
-
Hydrogen exerts neuroprotective effects by inhibiting oxidative stress in experimental diabetic peripheral neuropathy rats.Med Gas Res. 2023 Apr-Jun;13(2):72-77. doi: 10.4103/2045-9912.345171. Med Gas Res. 2023. PMID: 36204786 Free PMC article.
-
Effectiveness and safety of hydrogen inhalation as an adjunct treatment in Chinese type 2 diabetes patients: A retrospective, observational, double-arm, real-life clinical study.Front Endocrinol (Lausanne). 2023 Jan 18;13:1114221. doi: 10.3389/fendo.2022.1114221. eCollection 2022. Front Endocrinol (Lausanne). 2023. PMID: 36743938 Free PMC article.
-
The improvement of insulin level after hydrogen-rich water therapy in streptozotocin-induced diabetic rats.Vet World. 2022 Jan;15(1):182-187. doi: 10.14202/vetworld.2022.182-187. Epub 2022 Jan 28. Vet World. 2022. PMID: 35369585 Free PMC article.
References
-
- Wild S, Roglic G, Green A, Sicree R, King H (2004) Global prevalence of diabetes: estimates for the year 2000 and projections for 2030. Diabetes Care 27: 1047–1053. - PubMed
-
- Rinderknecht E, Humbel RE (1978) The amino acid sequence of human insulin-like growth factor I and its structural homology with proinsulin. J Biol Chem 253: 2769–2776. - PubMed
-
- Guler HP, Zapf J, Froesch ER (1987) Short-term metabolic effects of recombinant human insulin-like growth factor I in healthy adults. N Engl J Med 317: 137–140. - PubMed
-
- Frystyk J (2005) The growth hormone hypothesis - 2005 revision. Horm Metab Res 37 Suppl 144–48. - PubMed
Publication types
MeSH terms
Substances
LinkOut - more resources
Full Text Sources
Other Literature Sources
Medical
Miscellaneous

