. 2013;8(1):e53950.
doi: 10.1371/journal.pone.0053950. Epub 2013 Jan 9.

MiR-30-regulated autophagy mediates angiotensin II-induced myocardial hypertrophy

Affiliations

MiR-30-regulated autophagy mediates angiotensin II-induced myocardial hypertrophy

Wei Pan et al. PLoS One. 2013.

Abstract

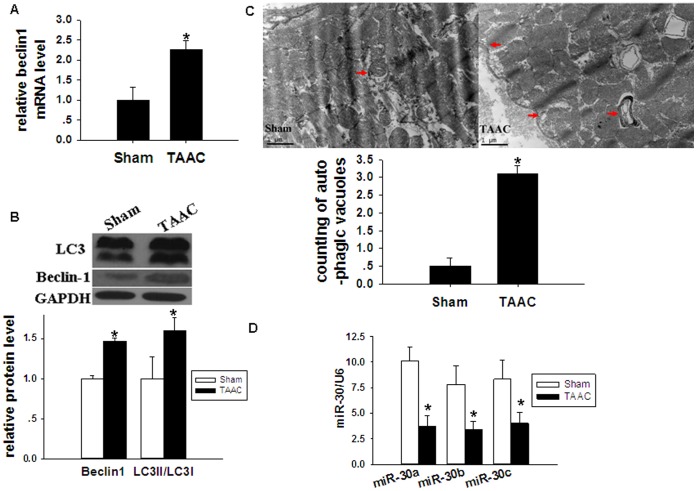
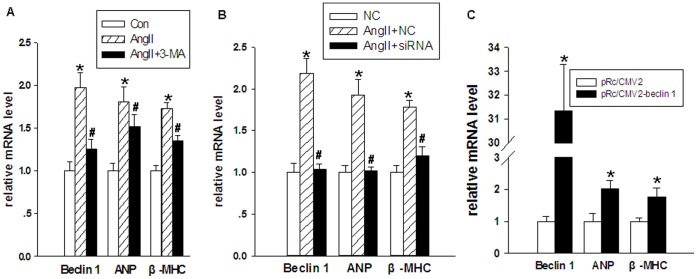
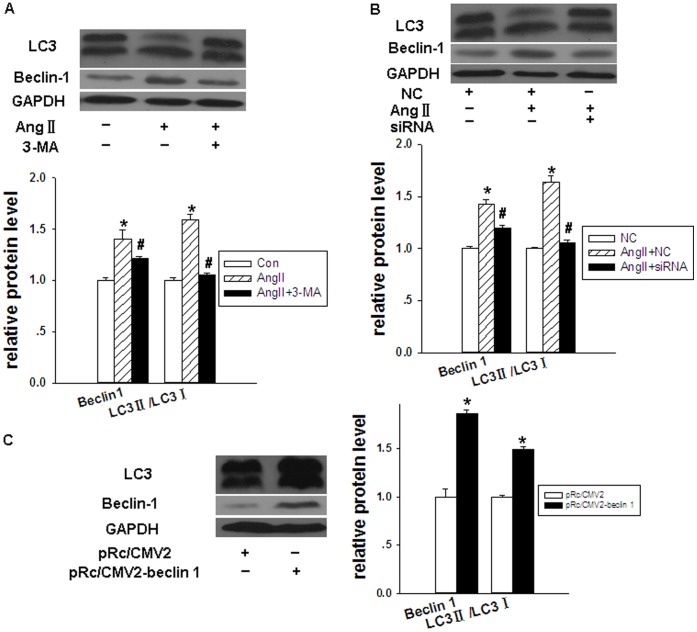
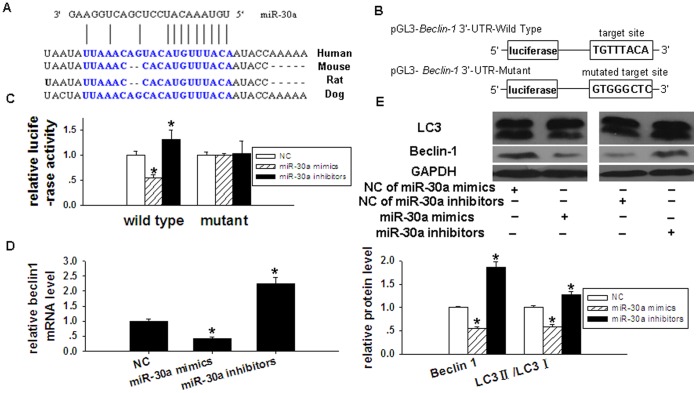
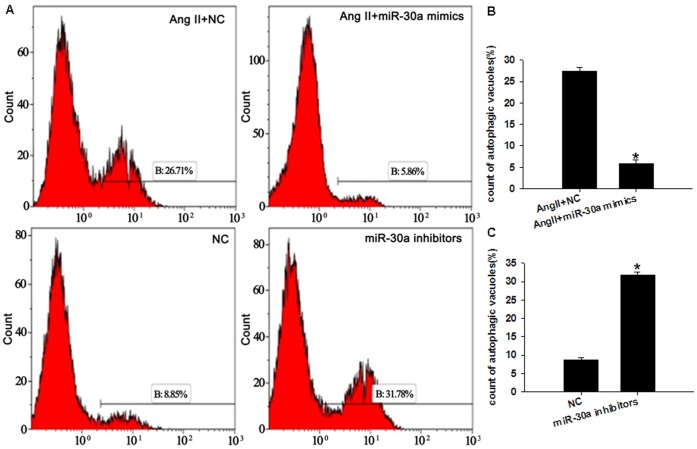
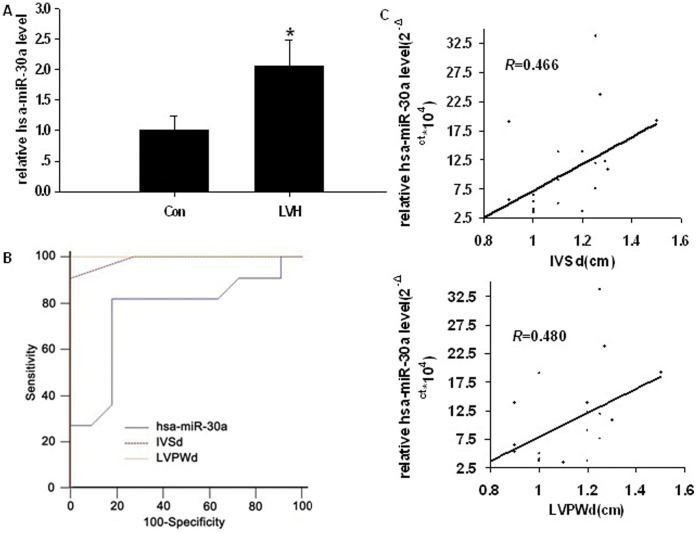
Dysregulated autophagy may lead to the development of disease. Role of autophagy and the diagnostic potential of microRNAs that regulate the autophagy in cardiac hypertrophy have not been evaluated. A rat model of cardiac hypertrophy was established using transverse abdominal aortic constriction (operation group). Cardiomyocyte autophagy was enhanced in rats from the operation group, compared with those in the sham operation group. Moreover, the operation group showed up-regulation of beclin-1 (an autophagy-related gene), and down-regulation of miR-30 in cardiac tissue. The effects of inhibition and over-expression of the beclin-1 gene on the expression of hypertrophy-related genes and on autophagy were assessed. Angiotensin II-induced myocardial hypertrophy was found to be mediated by over-expression of the beclin-1 gene. A dual luciferase reporter assay confirmed that beclin-1 was a target gene of miR-30a. miR-30a induced alterations in beclin-1 gene expression and autophagy in cardiomyocytes. Treatment of cardiomyocytes with miR-30a mimic attenuated the Angiotensin II-induced up-regulation of hypertrophy-related genes and decreased in the cardiomyocyte surface area. Conversely, treatment with miR-30a inhibitor enhanced the up-regulation of hypertrophy-related genes and increased the surface area of cardiomyocytes induced by Angiotensin II. In addition, circulating miR-30 was elevated in patients with left ventricular hypertrophy, and circulating miR-30 was positively associated with left ventricular wall thickness. Collectively, these above-mentioned results suggest that Angiotensin II induces down-regulation of miR-30 in cardiomyocytes, which in turn promotes myocardial hypertrophy through excessive autophagy. Circulating miR-30 may be an important marker for the diagnosis of left ventricular hypertrophy.


Conflict of interest statement

Competing Interests: The authors have declared that no competing interests exist.

Figures

Figure 1
Figure 1. Ventricular wall thickness was assessed using echocardiography in Wistar rats after TAAC surgery.
(A) Representative ultrasound through left ventricular from rats after Sham operation and transverse abdominal aortic constriction (TAAC)for 4 weeks. (B) Quantitative analysis of echocardiography for the left ventricular posterior wall thickness at end-systole (LVPWs), interventricular septal thickness at end-systole (IVSs), left ventricular posterior wall thickness at end-diastole (LVPWd) and interventricular septal thickness at end-diastole (IVSd), and comparison was performed between TAAC (n = 8) and Sham group(n = 6). Data are presented as means ± SEM. *P<0.05 compared with Sham.
Figure 2
Figure 2. Pathological examination of hearts from Wistar rats after TAAC surgery.
(A) Scanning images of the HE-stained paraffin sections of the hearts from Sham and TAAC rats, and the scale bar: 1 cm. (B) Microscopic images of the HE-stained paraffin sections of the hearts from Sham and TAAC rats, and the scale bar: 50 µm. Cardiac tissue color was lighter with inhomogeneous staining, numerous nuclear-free regions were evident, and an increased nucleolar density in muscle fibers in regions of atrophy was observed. (C) Microscopic images of the Masson’s-stained paraffin sections of the hearts from Sham and TAAC rats, and the scale bar: 50 µm. The regions of fibroplasia around blood vessels were presented as blue. (D)Heart weight index (HWI) was assessed by heart weight-to-body weight ratio. (E) The relative cross-sectional area was evaluated by calculating the ratio of the cardiac muscle fiber surface area of the microscopic images of the paraffin sections. Data are presented as means ± SEM. *P<0.05 compared with Sham.
Figure 3
Figure 3. Autophagy and miR-30 expression in rats after TAAC surgery.
The relative expression of mRNA level, microRNA level, protein, and autophagic vacuoles in left ventricular tissues from Sham and TAAC rats was analyzed 4 weeks after the operation. (A) Relative mRNA expression level of beclin-1 was analyzed by qRT-PCR. 18S was used as an internal control. (B) Relative expression of autophagy-related proteins, beclin-1 and LC3, was analyzed by Western blotting. GAPDH was used as an internal control. (C) Autophagic vacuoles (arrows indicated) were detected by transmission electron microscopy, at a magnification of ×13500. Scale bar: 1 µm. (D) Relative miR-30a, miR-30b and miR-30c expression which was presented as 2−Δct*10−3 was analyzed by qRT-PCR. U6 was used as an internal control. Data are presented as means ± SEM. *P<0.05 compared with Sham.
Figure 4
Figure 4. The role of the beclin-1 gene in the development of myocardial hypertrophy.
The relative mRNA level of beclin-1, ANP, and β-MHC in cardiomyocytes was analyzed by qRT-PCR. 18S was used as an internal control. Data are presented as means ± SEM. (A) Evaluation of the influence of 3-methyladenine (3-MA) on the expression of beclin-1 and hypertrophy related genes. Con: control group, Ang II: treated with 1 µmol/L Angiotensin II, and Ang II+3-MA: treated with 1 µmol/L Angiotensin II and 10 mmol/L 3-MA. *P<0.05 compared with Con; # P<0.05 compared with Ang II group. (B) Evaluation of the influence of beclin-1 specific siRNA on the expression of beclin-1 and hypertrophy related genes. NC: treated with lentivirus containing negative control of beclin-1-specific siRNA, Ang II+ NC: treated with lentivirus containing negative control of beclin-1-specific siRNA and 1 µmol/L Angiotensin II, and Ang II+siRNA: treated with lentivirus containing beclin-1-specific siRNA and 1 µmol/L Angiotensin II. *P<0.05 compared with NC group; # P<0.05 compared with Ang II+NC group. (C) Evaluation of the influence of pRc/CMV2-beclin-1 vector on the expression of beclin-1 and hypertrophy related genes. pRc/CMV2: transfected with pRc/CMV2 vector, and pRc/CMV2-beclin-1: transfected with pRc/CMV2-beclin-1. *P<0.05 compared with pRc/CMV2 group.
Figure 5
Figure 5. Expression of autophagy-related protein in cardiomyocytes varies with that of the beclin-1 gene.
The relative expression of autophagy-related protein in cardiomyocytes was analyzed by Western blotting. GAPDH was used as an internal control. Data are presented as means ± SEM. (A) Evaluation of the influence of 3-MA on the expression of LC3II/LC3I and beclin-1 proteins. Con: control group, Ang II: treated with 1 µmol/L Angiotensin II, and Ang II+3-MA: treated with 1 µmol/L Angiotensin II and 10 mmol/L 3-MA. *P<0.05 compared with Con group; # P<0.05 compared with Ang II group. (B) Evaluation of the influence of beclin-1 specific siRNA on the expression of autophagy-related proteins. NC: treated with lentivirus containing negative control of beclin-1-specific siRNA, Ang II+ NC: treated with lentivirus containing negative control of beclin-1-specific siRNA and 1 µmol/L Angiotensin II, and Ang II+siRNA: treated with lentivirus containing beclin-1-specific siRNA and 1 µmol/L Angiotensin II. *P<0.05 compared with NC group; # P<0.05 compared with Ang II+NC group. (C) Evaluation of the influence of pRc/CMV2-beclin-1 vector on LC3II/LC3I and beclin-1 proteins. pRc/CMV2: transfected with pRc/CMV2 vector, and pRc/CMV2-beclin-1: transfected with pRc/CMV2-beclin-1. *P<0.05 compared with pRc/CMV2 group.
Figure 6
Figure 6. The percentage of autophagic vacuoles varies with beclin-1 gene expression.
The autophagic vacuoles was analyzed by calculating MDC-stained cardiomyocytes using flow cytometry. (A, C and E) Representative percentage of autophagic vacuoles measured in MDC-stained cardiomyocytes using flow cytometry. (B) Evaluation of the influence of 3-MA on autophagic vacuoles. Con: control group, Ang II: treated with 1 µmol/L Angiotensin II, and Ang II+3-MA: treated with 1 µmol/L Angiotensin II and 10 mmol/L 3-MA. *P<0.05 compared with Con group; # P<0.05 compared with Ang II group. (D) Evaluation of the influence of beclin-1 specific siRNA on autophagic vacuoles. NC: treated with lentivirus containing negative control of beclin-1-specific siRNA, Ang II+ NC: treated with lentivirus containing negative control of beclin-1-specific siRNA and 1 µmol/L Angiotensin II, and Ang II+siRNA: treated with lentivirus containing beclin-1-specific siRNA and 1 µmol/L Angiotensin II. *P<0.05 compared with NC group; # P<0.05 compared with Ang II+NC group. (F) Evaluation of the influence of pRc/CMV2-beclin-1 vector on autophagic vacuoles. pRc/CMV2: transfected with pRc/CMV2 vector, and pRc/CMV2-beclin-1: transfected with pRc/CMV2-beclin-1. *P<0.05 compared with pRc/CMV2 group. Data are presented as means ± SEM.
Figure 7
Figure 7. Autophagic vacuole number varies with beclin-1 gene expression.
The autophagic vacuoles was analyzed by transmission electron microscopy. (A) Representative autophagic vacuoles (arrows indicated) were detected by transmission electron microscopy. Magnification of the first seven images: ×13500. The final image showed an autophagic vacuole under x46000 magnificationor: part of the cytoplasm and the organelle were packaged into specific double-membrane structures. Scale bar of the first seven images: 1 µm. Scale bar of the final image:200 nm.1 µm. –regulation. (B) Evaluation of the influence of up-regulation of beclin-1 on autophagic vacuoles. Con: control group, Ang II: treated with 1 µmol/L Angiotensin II, miR-30a inhibitors: treated with miR-30a inhibitors, and pRc/CMV2-beclin-1: treated with pRc/CMV2-beclin-1. *P<0.05 compared with Con group. (C) Evaluation of the influence of down-regulation of beclin-1 on autophagic vacuoles. Ang II: treated with 1 µmol/L Angiotensin II, Ang II+3-MA: treated with 1 µmol/L Angiotensin II and 10 mmol/L 3-MA, Ang II+siRNA: treated with beclin-1-specific siRNA and 1 µmol/L Angiotensin II, and Ang II+miR-30a mimics: treated with 1 µmol/L Angiotensin II and miR-30a mimics. *P<0.05 compared with Ang II group. Data are presented as means ± SEM.
Figure 8
Figure 8. Beclin-1 is a target gene of miR-30a.
(A) Sequence alignment between miR-30a and the 3′-UTR of beclin-1 in several species. (B) The schematic diagram of the plasmid of pGL3-Beclin-1 3′-UTR-Wild Type and pGL3- Beclin-1 3′-UTR-Mutant. The wild-type and mutated sequences of the target site of miR-30a on the 3′-UTR of Beclin-1 were shown. (C) Analysis of the relative luciferase activity in cardiomyocytes cotransfected with pGL3-Beclin-1 3′-UTR-Wild Type or pGL3-Beclin-1 3′-UTR-Mutant and miR-30a mimics, miR-30a inhibitors and negative control.*P<0.05 compared with NC group. (D) Evaluation of the influence of miR-30a on mRNA level of beclin-1 in cardiomyocytes. *P<0.05 compared with NC group. (E) Evaluation of the influence of miR-30a on expression of beclin-1 and LC3II/LC3I proteins in cardiomyocytes. *P<0.05 compared with NC group.
Figure 9
Figure 9. MiR-30a regulates the percentage of autophagic vacuoles.
The autophagic vacuoles was analyzed by calculating MDC-stained cardiomyocytes using flow cytometry. (A)Representative percentage of autophagic vacuoles measured in MDC-stained cardiomyocytes using flow cytometry. (B) Evaluation of the influence of miR-30a mimics on autophagic vacuoles. *P<0.05 compared with Ang II +NC group. (C) Evaluation of the influence of miR-30a inhibitors on autophagic vacuoles. *P<0.05 compared with NC group.
Figure 10
Figure 10. Down-regulation of miR-30 leads to myocardial hypertrophy.
(A) Relative expression of miR-30a in Ang II-stimulated cardiomyocytes (treated with 1 µmol/L Angiotensin II) and that in unstimulated cells by real-time RT-PCR relative to U6. *P<0.05 compared with Con group. (B) Evaluation of the influence of miR-30a on mRNA level of ANP and β-MHC in hypertrophic cardiomyocytes. *P<0.05 compared with Ang II+NC group. (C) Morphological changes were observed using confocal microscopy in cardiomyocytes stained with Alexa Fluor®555 Phalloidin and DAPI. Summarized data are shown in (D and E). (D) Evaluation of the influence of Ang II on relative cell area (the cardiac muscle fiber surface area ratio) in cardiomyocytes. *P<0.05 compared with Con group. (E) Evaluation of the influence of miR-30a on relative cell area in hypertrophic cardiomyocytes. *P<0.05 compared with Ang II+NC group.
Figure 11
Figure 11. circulating miR-30 expression in rats from the TAAC group.
The circulating miR-30a in rats (miR-30a in Rattus norvegicus, rno-miR-30a) from TAAC group and Sham group was analyzed by real-time RT-PCR 4 weeks after the operation. cel-miR-39 was used an endogenous control. *P<0.05 compared with Sham group.
Figure 12
Figure 12. Relationship between the circulating miR-30 level and ventricular wall thickness.
22 subjects were divided into two groups: LVH group (n = 11) and control group (n = 11). (A) Comparison of the circulating miR-30a (miR-30a in Homo sapiens, has-miR-30a) between patients with LVH and patients without LVH by real-time RT-PCR relative to cel-miR-39. *P<0.05 compared with Con group. (B) Evaluation of the sensitivity and specificity of has-miR-30a on the diagnosis of LVH was performed by analyzing the ROC curve using MedCalc11.3 software. (C) The association between circulating has-miR-30a level and ventricular wall thickness was assessed by Pearson correlation analysis. R: Pearson correlation coefficient.

Similar articles

Cited by

References

    1. Dai DF, Johnson SC, Villarin JJ, Chin MT, Nieves-Cintrón M, et al. (2011) Mitochondrial oxidative stress mediates angiotensin II-induced cardiac hypertrophy and Galphaq overexpression-induced heart failure. Circ Res 108: 837–846. - PMC - PubMed
    1. Cao DJ, Wang ZV, Battiprolu PK, Jiang N, Morales CR, et al. (2011) Histone deacetylase (HDAC) inhibitors attenuate cardiac hypertrophy by suppressing autophagy.proc natl acad sci USA. Proc Natl Acad Sci U S A 108: 4123–4128. - PMC - PubMed
    1. Glick D, Barth S, Macleod KF (2010) Autophagy: cellular and molecular mechanisms. J Pathol 221: 3–12. - PMC - PubMed
    1. Nakai A, Yamaguchi O, Takeda T, Higuchi Y, Hikoso S, et al. (2007) The role of autophagy in cardiomyocytes in the basal state and in response to hemodynamic stress.Nat Med. 13: 619–624. - PubMed
    1. Zhu H, Tannous P, Johnstone JL, Kong Y, Shelton JM, et al. (2007) Cardiac autophagy is a maladaptive response to hemodynamic stress. J Clin Invest 117: 1782–1793. - PMC - PubMed

Publication types

MeSH terms