

A new approach to assess the gastrocnemius muscle volume in rodents using ultrasound; comparison with the gastrocnemius muscle index
- PMID: 23326570
- PMCID: PMC3542319
- DOI: 10.1371/journal.pone.0054041
A new approach to assess the gastrocnemius muscle volume in rodents using ultrasound; comparison with the gastrocnemius muscle index
Erratum in
-
Correction: A New Approach to Assess the Gastrocnemius Muscle Volume in Rodents Using Ultrasound; Comparison with the Gastrocnemius Muscle Index.PLoS One. 2015 Jul 20;10(7):e0133944. doi: 10.1371/journal.pone.0133944. eCollection 2015. PLoS One. 2015. PMID: 26192186 Free PMC article. No abstract available.
Abstract
Introduction: The purpose of this study was to determine the reliability and validity of a new non-invasive ultrasound technique to measure gastrocnemius muscle atrophy after nerve denervation in an animal model.
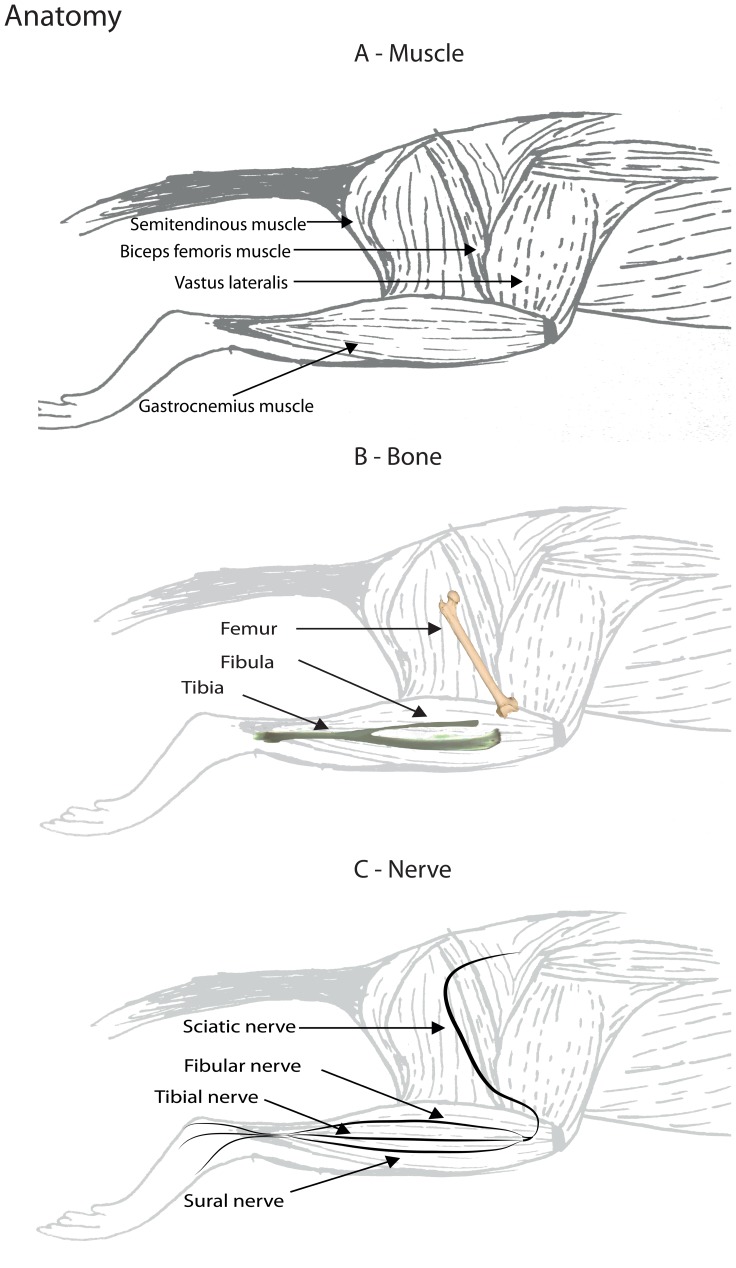
Methods: In sixteen rodents an eight mm sciatic nerve gap was created. In the following 8 weeks, each week, two rodents were euthanized and the gastrocnemius muscle was examined using two different ultrasound systems and two investigators. The standardized ultrasound measurement protocol consisted of identifying pre-defined anatomical landmarks: 1) the fibula, 2) the fibular nerve, and 3) the junction between the most distal point of the semitendinosus muscle and gastrocnemius muscle. Consequently, we measured the muscle thickness as the length of the line between the fibula and the junction between the two muscles, perpendicular to the fibular nerve. After the ultrasound recording, the muscle mass was determined.
Results: A steep decline of muscle weight of 24% was observed after one week. In the following weeks, the weight further decreased and then remained stable from 6 weeks onwards, resulting in a maximal muscle weight decrease of 82%. The correlation coefficient was >0.96 between muscle diameter and weight using both ultrasound systems. The inter-rater reliability was excellent for both devices on the operated side (ICC of 0.99 for both ultrasound systems) and good for the non-operated site (ICC's: 0.84 & 0.89). The difference between the muscle mass ratio and the muscle thickness ratio was not more than 5% with two outliers of approximately 13%.
Discussion: We have developed an innovative, highly reliable technique for quantifying muscle atrophy after nerve injury. This technique allows serial measurements in the same animal over time. This is a significant advantage compared to the conventional technique for quantifying muscle atrophy, which requires sacrificing the animal.
Conflict of interest statement
Figures


References
-
- Diao E, Vannuyen T (2000) Techniques for primary nerve repair. Hand Clin 16: 53–66, viii. - PubMed
-
- Sunderland IR, Brenner MJ, Singham J, Rickman SR, Hunter DA, et al. (2004) Effect of tension on nerve regeneration in rat sciatic nerve transection model. Annals of plastic surgery 53: 382–387. - PubMed
-
- Millesi H, Zoch G, Reihsner R (1995) Mechanical properties of peripheral nerves. Clinical orthopaedics and related research: 76–83. - PubMed
-
- Deumens R, Bozkurt A, Meek MF, Marcus MA, Joosten EA, et al. (2010) Repairing injured peripheral nerves: Bridging the gap. Progress in neurobiology 92: 245–276. - PubMed
-
- Siemionow M, Bozkurt M, Zor F (2010) Regeneration and repair of peripheral nerves with different biomaterials: review. Microsurgery 30: 574–588. - PubMed
MeSH terms
LinkOut - more resources
Full Text Sources
Other Literature Sources
Miscellaneous
