

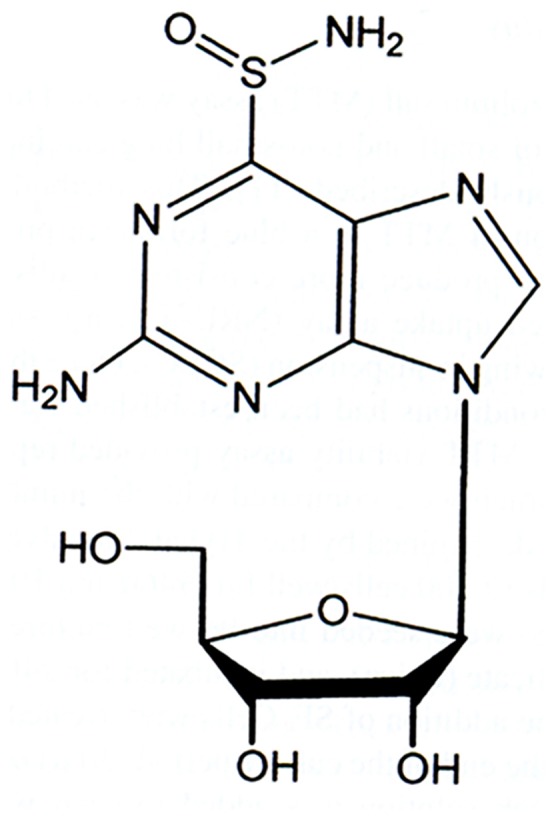
Purine nucleoside analog--sulfinosine modulates diverse mechanisms of cancer progression in multi-drug resistant cancer cell lines
- PMID: 23326571
- PMCID: PMC3543365
- DOI: 10.1371/journal.pone.0054044
Purine nucleoside analog--sulfinosine modulates diverse mechanisms of cancer progression in multi-drug resistant cancer cell lines
Abstract
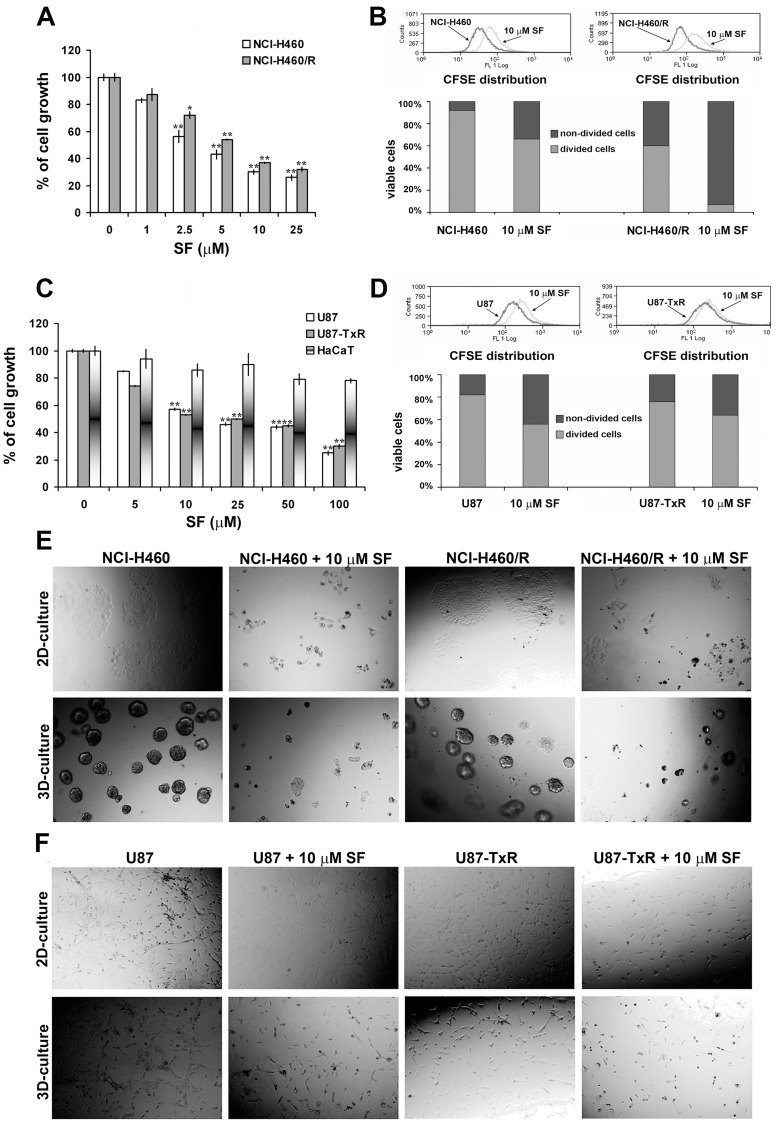
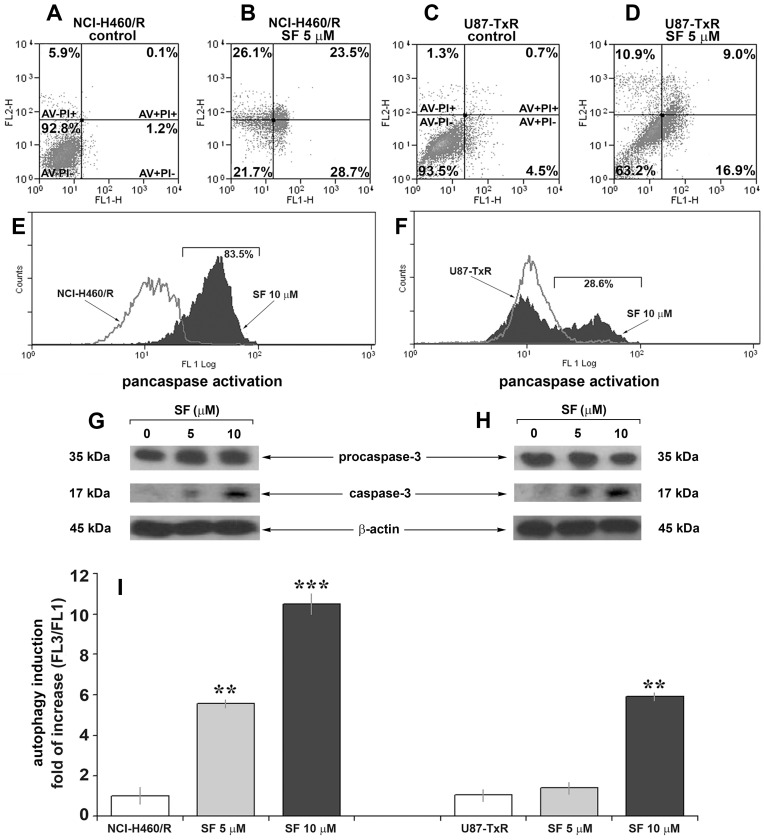
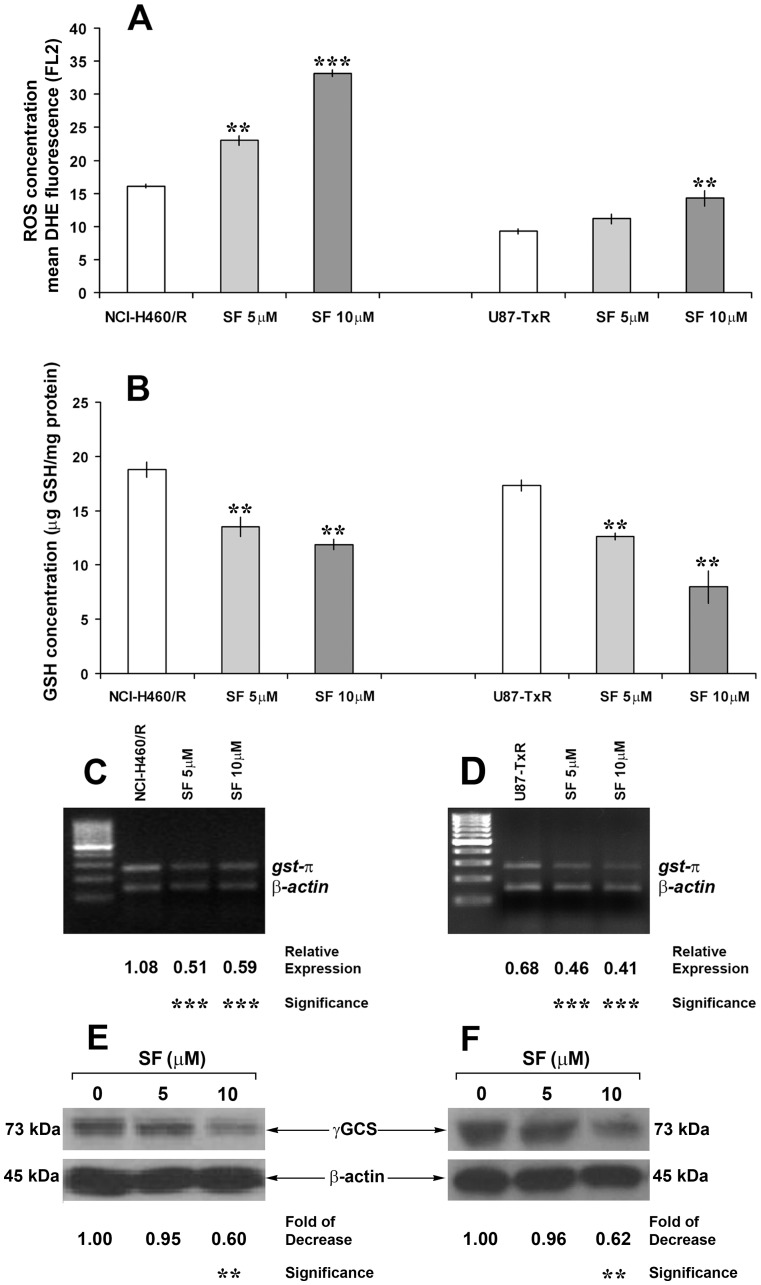
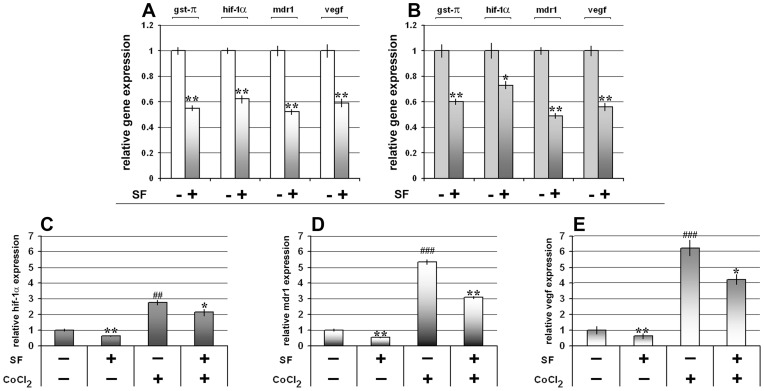
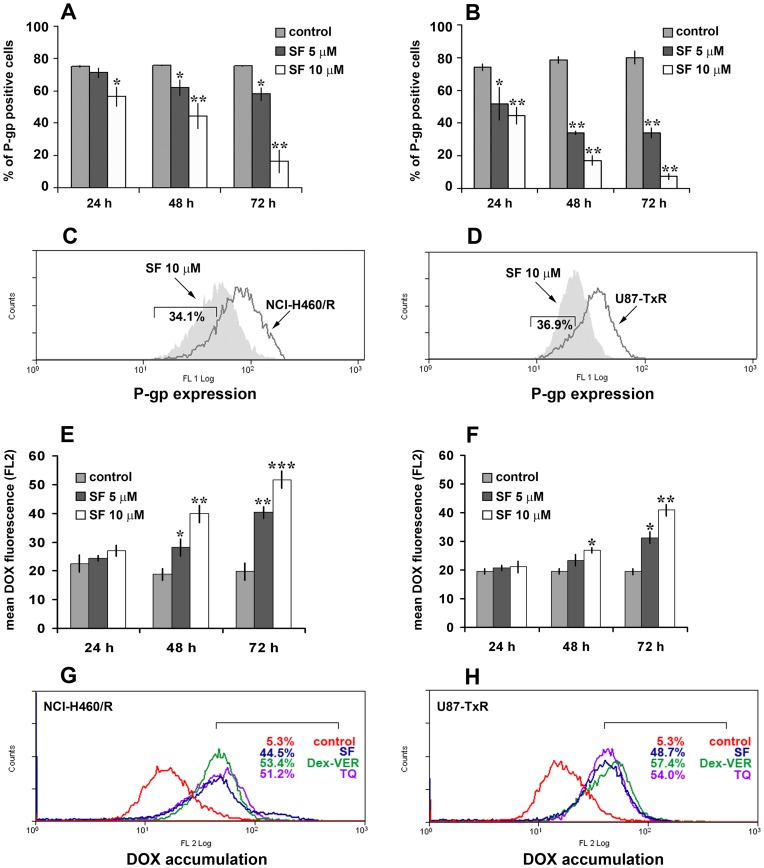
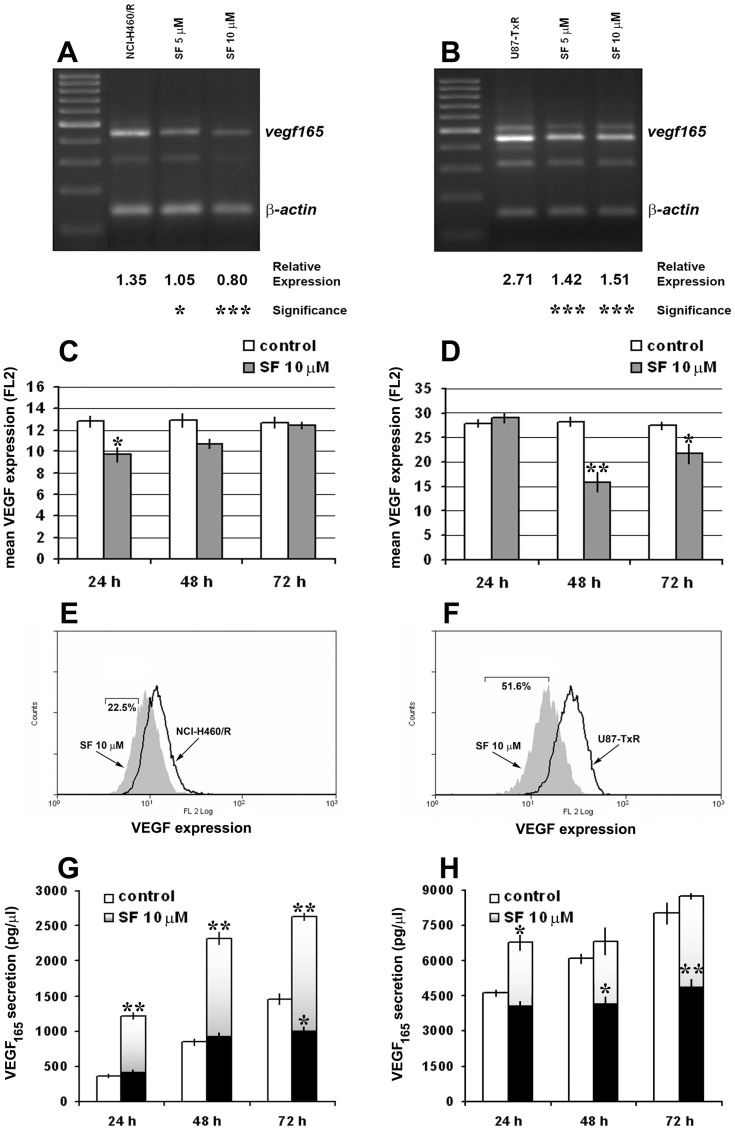
Achieving an effective treatment of cancer is difficult, particularly when resistance to conventional chemotherapy is developed. P-glycoprotein (P-gp) activity governs multi-drug resistance (MDR) development in different cancer cell types. Identification of anti-cancer agents with the potential to kill cancer cells and at the same time inhibit MDR is important to intensify the search for novel therapeutic approaches. We examined the effects of sulfinosine (SF), a quite unexplored purine nucleoside analog, in MDR (P-gp over-expressing) non-small cell lung carcinoma (NSCLC) and glioblastoma cell lines (NCI-H460/R and U87-TxR, respectively). SF showed the same efficacy against MDR cancer cell lines and their sensitive counterparts. However, it was non-toxic for normal human keratinocytes (HaCaT). SF induced caspase-dependent apoptotic cell death and autophagy in MDR cancer cells. After SF application, reactive oxygen species (ROS) were generated and glutathione (GSH) concentration was decreased. The expression of key enzyme for GSH synthesis, gamma Glutamyl-cysteine-synthetase (γGCS) was decreased as well as the expression of gst-π mRNA. Consequently, SF significantly decreased the expression of hif-1α, mdr1 and vegf mRNAs even in hypoxic conditions. SF caused the inhibition of P-gp (coded by mdr1) expression and activity. The accumulation of standard chemotherapeutic agent--doxorubicin (DOX) was induced by SF in concentration- and time-dependent manner. The best effect of SF was obtained after 72 h when it attained the effect of known P-gp inhibitors (Dex-verapamil and tariquidar). Accordingly, SF sensitized the resistant cancer cells to DOX in subsequent treatment. Furthermore, SF decreased the experssion of vascular endothelial growth factor (VEGF) on mRNA and protein level and modulated its secretion. In conclusion, the effects on P-gp (implicated in pharmacokinetics and MDR), GSH (implicated in detoxification) and VEGF (implicated in tumor-angiogenesis and progression) qualify SF as multi-potent anti-cancer agent, which use must be considered, in particular for resistant malignancies.
Conflict of interest statement
Figures
Similar articles
-
Sulfinosine enhances doxorubicin efficacy through synergism and by reversing multidrug resistance in the human non-small cell lung carcinoma cell line (NCI-H460/R).Invest New Drugs. 2009 Apr;27(2):99-110. doi: 10.1007/s10637-008-9140-5. Epub 2008 May 21. Invest New Drugs. 2009. PMID: 18493718
-
Purine analogs sensitize the multidrug resistant cell line (NCI-H460/R) to doxorubicin and stimulate the cell growth inhibitory effect of verapamil.Invest New Drugs. 2010 Aug;28(4):482-92. doi: 10.1007/s10637-009-9277-x. Epub 2009 Jun 18. Invest New Drugs. 2010. PMID: 19533022
-
Synergistic effects of the purine analog sulfinosine and curcumin on the multidrug resistant human non-small cell lung carcinoma cell line (NCI-H460/R).Cancer Biol Ther. 2008 Jul;7(7):1024-32. doi: 10.4161/cbt.7.7.6036. Epub 2008 Apr 4. Cancer Biol Ther. 2008. PMID: 18414057
-
Structure, function and regulation of P-glycoprotein and its clinical relevance in drug disposition.Xenobiotica. 2008 Jul;38(7-8):802-32. doi: 10.1080/00498250701867889. Xenobiotica. 2008. PMID: 18668431 Review.
-
Molecular targeting therapy of cancer: drug resistance, apoptosis and survival signal.Cancer Sci. 2003 Jan;94(1):15-21. doi: 10.1111/j.1349-7006.2003.tb01345.x. Cancer Sci. 2003. PMID: 12708468 Free PMC article. Review.
Cited by
-
Autophagy Inhibition Enhances Anti-Glioblastoma Effects of Pyrazolo[3,4-d]pyrimidine Tyrosine Kinase Inhibitors.Life (Basel). 2022 Sep 27;12(10):1503. doi: 10.3390/life12101503. Life (Basel). 2022. PMID: 36294938 Free PMC article.
-
Guanosine promotes cytotoxicity via adenosine receptors and induces apoptosis in temozolomide-treated A172 glioma cells.Purinergic Signal. 2017 Sep;13(3):305-318. doi: 10.1007/s11302-017-9562-7. Epub 2017 May 23. Purinergic Signal. 2017. PMID: 28536931 Free PMC article.
-
Unraveling the Complexity of Regulated Cell Death in Esophageal Cancer: from Underlying Mechanisms to Targeted Therapeutics.Int J Biol Sci. 2023 Jul 31;19(12):3831-3868. doi: 10.7150/ijbs.85753. eCollection 2023. Int J Biol Sci. 2023. PMID: 37564206 Free PMC article. Review.
-
Unraveling the Potential Role of Glutathione in Multiple Forms of Cell Death in Cancer Therapy.Oxid Med Cell Longev. 2019 Jun 10;2019:3150145. doi: 10.1155/2019/3150145. eCollection 2019. Oxid Med Cell Longev. 2019. PMID: 31281572 Free PMC article. Review.
-
Priming cancer cells for drug resistance: role of the fibroblast niche.Front Biol (Beijing). 2014 Feb 1;9(2):114-126. doi: 10.1007/s11515-014-1300-8. Front Biol (Beijing). 2014. PMID: 25045348 Free PMC article.
References
-
- Revankar GR, Hanna NB, Imamura N, Lewis AF, Larson SB, et al. (1990) Synthesis and in vivo antitumor activity of 2-amino-9H-purine-6-sulfenamide, -sulfinamide, and -sulfonamide and related purine ribonucleosides. J Med Chem 33: 121–128. - PubMed
-
- Avery TL, Finch RA, Vasquez KM, Radparvar S, Hanna NB, et al. (1990) Chemotherapeutic characterization in mice of 2-amino-9-beta-D-ribofuranosylpurine-6-sulfinamide (sulfinosine), a novel purine nucleoside with unique antitumor properties. Cancer Res 50: 2625–2630. - PubMed
-
- Bosch TM, Meijerman I, Beijnen JH, Schellens JH (2006) Genetic polymorphisms of drug-metabolising enzymes and drug transporters in the chemotherapeutic treatment of cancer. Clin Pharmacokinet 45: 253–285. - PubMed
-
- Presta M, Belleri M, Vacca A, Ribatti D (2002) Anti-angiogenic activity of the purine analog 6-thioguanine. Leukemia 16: 1490–1499. - PubMed
-
- Pesić M, Andjelković T, Banković J, Marković ID, Rakić L, et al. (2009) Sulfinosine enhances doxorubicin efficacy through synergism and by reversing multidrug resistance in the human non-small cell lung carcinoma cell line (NCI-H460/R). Invest New Drugs 27: 99–110. - PubMed
Publication types
MeSH terms
Substances
LinkOut - more resources
Full Text Sources
Other Literature Sources
Research Materials
Miscellaneous
