. 2013 Jan 8:2:e00170.
doi: 10.7554/eLife.00170.

Dual functions of TAF7L in adipocyte differentiation

Affiliations

Dual functions of TAF7L in adipocyte differentiation

Haiying Zhou et al. Elife. .

Abstract

The diverse transcriptional mechanisms governing cellular differentiation and development of mammalian tissue remains poorly understood. Here we report that TAF7L, a paralogue of TFIID subunit TAF7, is enriched in adipocytes and white fat tissue (WAT) in mouse. Depletion of TAF7L reduced adipocyte-specific gene expression, compromised adipocyte differentiation, and WAT development as well. Ectopic expression of TAF7L in myoblasts reprograms these muscle precursors into adipocytes upon induction. Genome-wide mRNA-seq expression profiling and ChIP-seq binding studies confirmed that TAF7L is required for activating adipocyte-specific genes via a dual mechanism wherein it interacts with PPARγ at enhancers and TBP/Pol II at core promoters. In vitro binding studies confirmed that TAF7L forms complexes with both TBP and PPARγ. These findings suggest that TAF7L plays an integral role in adipocyte gene expression by targeting enhancers as a cofactor for PPARγ and promoters as a component of the core transcriptional machinery.DOI:http://dx.doi.org/10.7554/eLife.00170.001.

Keywords: C3H10T½; ChIP-seq; Mouse; RNA-seq; TAF7L; adipogenesis; differentiation.


Conflict of interest statement

Robert Tjian is President of the Howard Hughes Medical Institute (2009–present), one of the three founding funders of eLife.

The remaining authors have declared that no competing interests exist.

Figures

Figure 1.
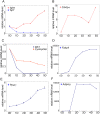
Figure 1.. TAF7L is enriched in terminally differentiated adipocytes and bona fide WAT.
(A) and (B) Expression of TAF7L and TFIID subunits prior to and 5 days (5D) post adipogenic induction of C3H10T1/2 cells as shown by RT-qPCR analysis (A) and by Western blot (B). (C) mRNA levels of TFIID subunits in C2C12 cells and myotubes. (D) Taf7l mRNA levels in different mouse tissues detected by RT-qPCR relative to muscle, whose expression level was assigned to 1 as the tissue displaying the lowest Taf7l mRNA levels. (E) Western blot analysis of mouse tissues with TAF4 and TAF7L antibodies. mRNA levels in (A) and (C) was assigned to 1 in C3H10T1/2 and C2C12 cells, mRNA levels in adipocytes and myotubes were compared with C3H10T1/2 and C2C12 cells respectively. *p<0.05, data is mean and s.e.m is from triplicates. RT-qPCR was normalized to the amount of total mRNA and Western blotting analysis was normalized to the amount of total protein. D, days; 10T1/2, C3H10T1/2 cells; ES, embryonic stem cell; BAT, brown adipose tissue; WAT, white adipose tissue. DOI: http://dx.doi.org/10.7554/eLife.00170.003
Figure 1—figure supplement 1.
Figure 1—figure supplement 1.. TAF7L is enriched in 3T3-L1 differentiated adipocytes.
(A) Expression of Taf7l and TFIID subunits prior to and 7 days (7D) post adipogenic induction of 3T3-L1 cells as shown by RT-qPCR analysis (A) and by Western blot (C). (B) Gene expression of adipocyte marker genes Adipsin, Adipoq and Fabp4 of 3T3-L1 adipocytes prior to and 7 days post adipogenic induction. mRNA levels in 3T3-L1 cells were assigned to 1, mRNA levels of each gene in 3T3-L1 adipocytes were compared to 3T3-L1 cells, data is mean from triplicates. DOI: http://dx.doi.org/10.7554/eLife.00170.004
Figure 1—figure supplement 2.
Figure 1—figure supplement 2.. Gene expression analysis of C3H10T1/2 cells during adipogenesis.
(A)–(F) Time course analysis by RT-qPCR analysis of Taf7l and Taf7 (A), C/ebpα (B), Dlk1 and Cyclophilin (C), Fabp4 (D), Pparγ (E) and Adipoq (F) in C3H10T1/2 cells at 0D, 1D, 2D, 3D, 4D and 5D post adipogenic induction. D, days, mRNA levels in C3H10T1/2 cells at 0D were assigned to 1, mRNA levels of each gene at 0D, 1D, 2D, 3D, 4D, and 5D in C3H10T1/2 cells during adipogenesis were compared to 0D respectively, and data is mean from triplicates. DOI: http://dx.doi.org/10.7554/eLife.00170.005
Figure 2.
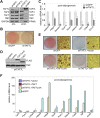
Figure 2.. TAF7L is required for adipogenesis in vitro.
(A) Western blot of TAF7L, TAF4, TAF7, TBP, GAPDH, and PPARγ protein levels in C3H10T1/2 cells expressing shRNA sequence against GFP as control (shGFP) or specifically against TAF7L (shTAF7L) pre- (left panel) and post-differentiation (right panel). GAPDH protein levels serve as a loading control. (B) Oil red O staining in 5 days differentiated C3H10T1/2 cells stably expressing either shGFP or shTAF7L. (C) mRNA levels of adipocyte-specific genes by RT-qPCR on differentiated shGFP or shTAF7L C3H10T1/2 cells from (B), mRNA levels in shGFP cells were assigned to 1, mRNA levels of each gene in shTAF7L cells were compared to shGFP cells, *p<0.05, data is mean and s.e.m is from triplicates. RT-qPCR was normalized to the amount of total mRNA. (D) Western blot with FLAG and TBP antibodies showing the expression of FLAG-TAF7LmA and FLAG-TAF7 in shTAF7L stably transfected C3H10T1/2 cells, TBP protein levels serve as a loading control. (E) Oil red O staining on shGFP or shTAF7L cells ectopically expressing FLAG, FLAG-TAF7 or FLAG-TAF7LmA 5 days post adipogenesis. (F) mRNA levels of adipocyte-specific genes by RT-qPCR in differentiated cells from (E), mRNA levels in shTAF7L + vector cells were assigned to 1, mRNA levels of each gene in shTAF7L + TAF7, shTAF7L + TAF7LmA and shGFP cells were compared to shTAF7L + vector cells, data is mean from triplicates. DOI: http://dx.doi.org/10.7554/eLife.00170.006
Figure 2—figure supplement 1.
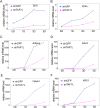
Figure 2—figure supplement 1.. Gene expression analysis after TAF7L knockdown in C3H10T1/2 cells.
(A)–(F) Time course of gene expression by RT-qPCR analysis of Taf7l (A), Pparγ (B), Adipoq (C), Glut4 (D), Fabp4 (E), and Klf15 (F) in C3H10T1/2 cells stably treated with shGFP or shTAF7L sequences at 0D, 1D, 3D, and 5D post adipogenic induction. D, days; shGFP, control cells; shTAF7L, TAF7L knockdown cells. mRNA levels in shTAF7L-treated C3H10T1/2 cells at 0D were assigned to 1, mRNA levels of each gene at 0D, 1D, 3D, and 5D in both shGFP and shTAF7L-treated C3H10T1/2 cells during adipogenesis were compared to mRNA levels in shTAF7L-treated C3H10T1/2 cells at 0D respectively, data is mean from triplicates. DOI: http://dx.doi.org/10.7554/eLife.00170.007
Figure 3.
Figure 3.. TAF7L is required for the expression of adipocyte-specific genes.
(A) and (B), mRNA-seq data on gene expression of C3H10T1/2 cells pre- (horizontal axis) and post-adipogenesis (vertical axis) (A); mRNA-seq data on gene expression in C3H10T1/2 cells pre-adipogenesis (horizontal axis) and C3H10T1/2 treated with shTAF7L post-adipogenesis (vertical axis) (B). Orange dots in (A) mark genes upregulated during adipogenesis; blue dots in (A) mark genes unchanged or downregulated during adipogenesis. Circled genes were tested individually in RT-qPCR analysis. R indicates the correlation of the expression programs between two compared cells (10T1/2-post vs 10T1/2-pre in (A), 10T1/2-shTAF7L-post vs 10T1/2-pre in (B)). (C) TAF7L knockdown blocks the upregulation of the adipocyte-specific genes which occurs during normal adipogenesis, pink circle represents 2360 genes upregulated in 10T1/2-post by 10-fold (10×) from (A); orange circle represents 2226 genes unchanged in 10T1/2-shTAF7L-post (B) compared to (A), 2083 genes in the overlapping intersect region account for 88% of total upregulated 10× genes in (A). (D) List of gene ontology analysis hits showing a few typical adipocyte genes involved in fat cell differentiation and metabolic processes. DOI: http://dx.doi.org/10.7554/eLife.00170.008
Figure 4.
Figure 4.. Taf7l is required for WAT development in vivo.
(A) Oil red O staining to detect mature adipocytes from 5 day differentiated primary fibroblasts derived from adipose tissue of wild-type (WT) and Taf7l-deficient mice (KO). (B) mRNA levels of adipocyte-specific genes by RT-qPCR on WT and Taf7l KO primary fibroblasts post differentiation from (A), mRNA levels in WT cells were assigned to 1, mRNA levels of each gene in Taf7l KO cells were compared to WT cells, *p<0.05, data is mean and s.e.m is from triplicates. RT-qPCR was normalized to the amount of total mRNA. (C) Average food intake of WT and KO mice from week 4 to week 9 after birth. n = 9. (D) Average body weights of WT and KO littermates from week 4 to week 9 after birth, n = 9. (E) H&E and FABP4 antibody stain subcutaneous fat cells in E18.5 WT and Taf7l KO embryos, left panel magnification, ×5; right panel magnification, ×20; red arrows indicate fat cells stained by FABP4. (F) Taf7l KO mice exhibits less fat tissue than WT littermate. Shown are representative photographs of 1-month-old mice with skin removed from both front and back views. (G) Taf7l KO mouse exhibits less fat formation than WT littermate. Shown is a representative photograph of 4-month-old mouse with skin removal. DOI: http://dx.doi.org/10.7554/eLife.00170.009
Figure 5.
Figure 5.. Ectopic expression of TAF7L transdifferentiates C2C12 myoblasts into adipocytes under adipogenic induction.
(A) C2C12 myoblasts expressing empty vector (C2C12.CNTL) or TAF7L (C2C12.TAF7L) were stained with Oil red O 5 days after inducing adipogenesis. (B) Western blot analysis on ectopic expression levels of FLAG-TAF7L in C2C12.7L and C2C12.CNTL cells, β-actin protein level is served as a loading control. CNTL, C2C12.CNTL; TAF7L, C2C12.TAF7L. (C) mRNA levels of adipocyte marker genes are measured by RT-qPCR in C2C12.TAF7L cells compared with C2C12.CNTL cells 5 days post adipogenesis, mRNA levels of genes in C2C12.CNTL cells were assigned to 1. *p<0.05, data is mean and s.e.m is from triplicates. RT-qPCR was normalized to the amount of total mRNA. (D) mRNA-seq analyzes genes activated by TAF7L in C2C12.TAF7L compared to C2C12.CNTL post adipogenesis. Red dots represent genes upregulated in C2C12.TAF7L-post cells; blue dots represent genes unaltered or downregulated in C2C12.TAF7L-post cells compared to C2C12.CNTL-post cells after adipogenic induction. (E) Major gene functional groups from genes activated above fivefold by TAF7L in C2C12 cells post adipogenic induction through gene ontology analysis. DOI: http://dx.doi.org/10.7554/eLife.00170.010
Figure 5—figure supplement 1.
Figure 5—figure supplement 1.. Gene expression analysis of TAF7L-expressing C2C12 cells.
(A)–(F) Time course of gene expression by RT-qPCR analysis of Taf7l (A), Pparγ (B), C/ebpα (C), Myf5 (D), Adipoq (E), and Fabp4 (F) in C2C12.CNTL and C2C12.TAF7L cells at 0D, 1D, 2D, 3D, 4D and 5D post adipogenic induction. D, days; CNTL, C2C12.CNTL; TAF7L, C2C12.TAF7L. mRNA levels in C2C12.CNTL cells at 0D were assigned to 1, mRNA levels of each gene at 0D, 1D, 2D, 3D, 4D, and 5D in both C2C12.CNTL and C2C12.TAF7L cells during adipogenesis were compared to mRNA levels in C2C12.CNTL cells at 0D respectively, data is mean from triplicates. DOI: http://dx.doi.org/10.7554/eLife.00170.011
Figure 6.
Figure 6.. TAF7L binds strongly on the majority of genes upregulated during adipogenesis.
(A) Read accumulation for eight ChIP-seq datasets including TAF7L, PPARγ, TBP and Pol II before (_pre) and after (_post) adipocyte differentiation at the Rfc4 and Adipoq gene loci. (B) The same as in (A) at the Ccdc37 and Klf15 gene loci. Vertical axis is 0–500 reads for all factors, co-localized peaks were marked with boxes, black boxes indicate promoters and red boxes indicate enhancers, solid lines denote active genes and dashed lines denote inactive gene. (C) Frequency (vertical axis) of TAF7L occupancy on gene expression groups (horizontal axis) including unchanged (low, med, high) (three blue dots regions from left-bottom to right-top in Figure 3A), downregulated (blue dots in left-bottom region in Figure 3A), and upregulated (>5×, >50×, two orange dots regions from lower to higher in Figure 3A). (D) Average TAF7L binding signal strength (vertical axis) on the core promoters (500 bp from TSS) and proximal enhancers (500 bp to 5 kb from TSS) of three major gene expression groups as in (C). (Regular t-test for (C) and (D), NS is no significant, *p<0.05, ***p<0.001). DOI: http://dx.doi.org/10.7554/eLife.00170.012
Figure 7.
Figure 7.. TAF7L colocalizes and associates with PPARγ and TBP.
(A) Two top motifs (motif 1 and motif 2) were found in TAF7L binding sites. Motif1 p<2e-20) matches with PPARγ binding motif and motif 2 p<3e-10) matches with C/EBPα binding motif. (B) Overlap of PPARγ peaks with TAF7L peaks in adipocytes, each circle represents the total peaks from ChIP-seq for a factor and the overlapped region represents the common binding peaks of the factors. (C) Similar as in (B); Pol II, TBP and TAF7L peaks from ChIP-seq overlap with each other in adipocytes. (D) Table showed the total peak numbers of each factor in adipocytes from ChIP-seq and the percentage of genome-wide peak overlapping between TAF7L and PPARγ, Pol II, TBP, IgG control. (E) FLAG tagged TAF7L, HA tagged PPARγ were overexpressed in 293T cells, immunoprecipitations were performed on both FLAG and HA antibodies and followed by Western blotting with FLAG and HA antibodies. (F) The same procedures were performed on FLAG tagged PPARγ and HA tagged TBP. (G) The same procedures were performed on FLAG tagged TAF7L and HA tagged TBP as in (E). DOI: http://dx.doi.org/10.7554/eLife.00170.013
Figure 8.
Figure 8.. Dual functions of TAF7L in adipocyte differentiation.
TAF7L expression is enriched during C3H10T1/2 MSCs adipocyte differentiation while other TFIID subunits (TAFs) decrease in expression. TAF7L regulates adipogenesis by associating with TBP as a component of adipocyte TFIID complex at promoters and with PPARγ or other adipocyte transcriptional factors (ATFs) as a cofactor at enhancers on adipocyte-specific genes, providing the mechanisms of its dual roles during differentiation. General highly-expressed genes are those with high expression before and after adipocyte differentiation include a portion of housekeeping genes; adipocyte-specific genes are those required for adipocyte differentiation and highly upregulated during adipocyte differentiation. TAFs,TBP-associated factors; ATFs, adipocyte transcriptional factors; BEs, binding elements. DOI: http://dx.doi.org/10.7554/eLife.00170.014

References

    1. Akinloye O, Gromoll J, Callies C, Nieschlag E, Simoni M. 2007. Mutation analysis of the X-chromosome linked, testis-specific TAF7L gene in spermatogenic failure. Andrologia 39:190–5 - PubMed
    1. Armstrong JD, Coffey MT, Esbenshade KL, Campbell RM, Heimer EP. 1994. Concentrations of hormones and metabolites, estimates of metabolism, performance, and reproductive performance of sows actively immunized against growth hormone-releasing factor. J Anim Sci 72:1570–7 - PubMed
    1. Boergesen M, Pedersen TA, Gross B, van Heeringen SJ, Hagenbeek D, Bindesboll C, et al. 2012. Genome-wide profiling of liver X receptor, retinoid X receptor, and peroxisome proliferator-activated receptor alpha in mouse liver reveals extensive sharing of binding sites. Mol Cell Biol 32:852–67 - PMC - PubMed
    1. Bowers RR, Lane MD. 2008. Wnt signaling and adipocyte lineage commitment. Cell Cycle 7:1191–6 - PubMed
    1. Brun RP, Kim JB, Hu E, Altiok S, Spiegelman BM. 1996. Adipocyte differentiation: a transcriptional regulatory cascade. Curr Opin Cell Biol 8:826–32 - PubMed

Publication types

MeSH terms