

Use of somatic mutations to quantify random contributions to mouse development
- PMID: 23327737
- PMCID: PMC3564904
- DOI: 10.1186/1471-2164-14-39
Use of somatic mutations to quantify random contributions to mouse development
Abstract
Background: The C. elegans cell fate map, in which the lineage of its approximately 1000 cells is visibly charted beginning from the zygote, represents a developmental biology milestone. Nematode development is invariant from one specimen to the next, whereas in mammals, aspects of development are probabilistic, and development exhibits variation between even genetically identical individuals. Consequently, a single defined cell fate map applicable to all individuals cannot exist.
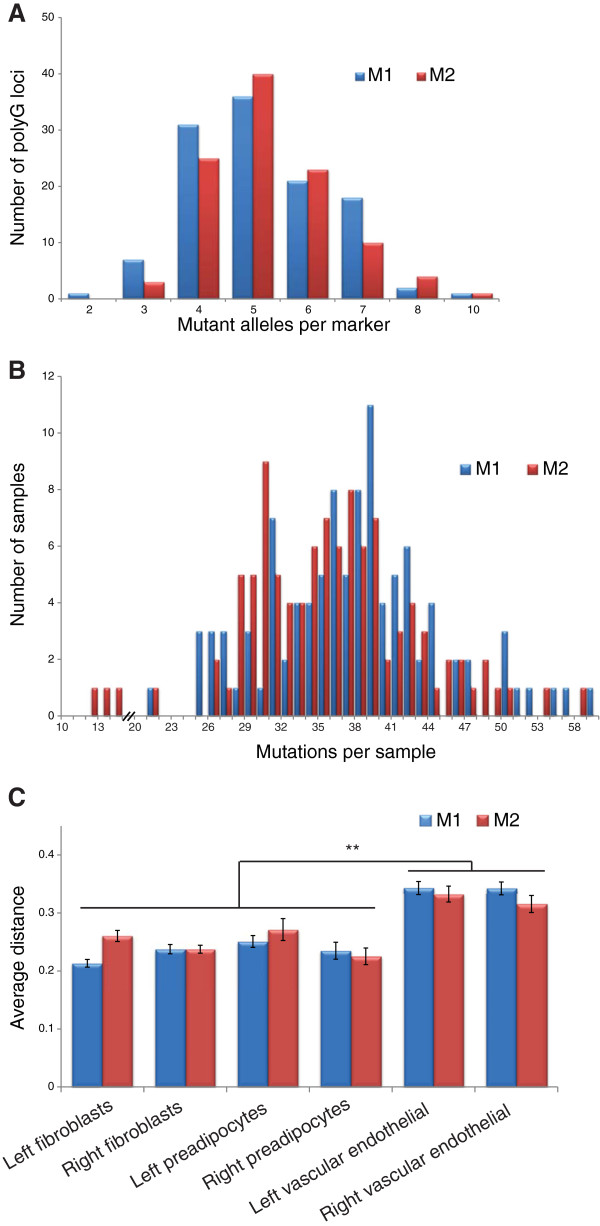
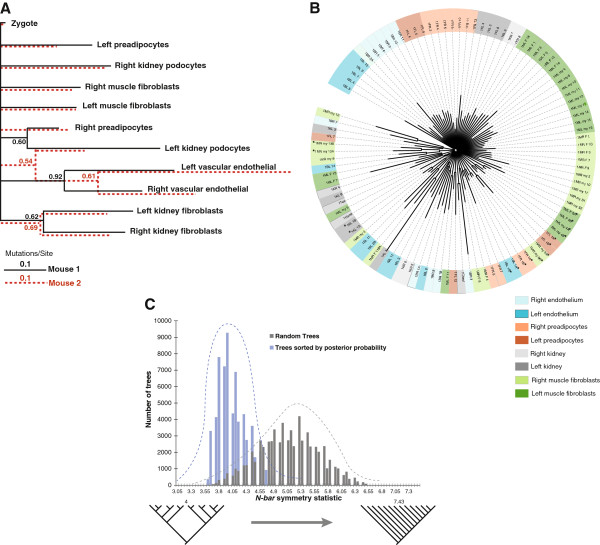
Results: To determine the extent to which patterns of cell lineage are conserved between different mice, we have employed the recently developed method of "phylogenetic fate mapping" to compare cell fate maps in siblings. In this approach, somatic mutations arising in individual cells are used to retrospectively deduce lineage relationships through phylogenetic and-as newly investigated here-related analytical approaches based on genetic distance. We have cataloged genomic mutations at an average of 110 mutation-prone polyguanine (polyG) tracts for about 100 cells clonally isolated from various corresponding tissues of each of two littermates of a hypermutable mouse strain.
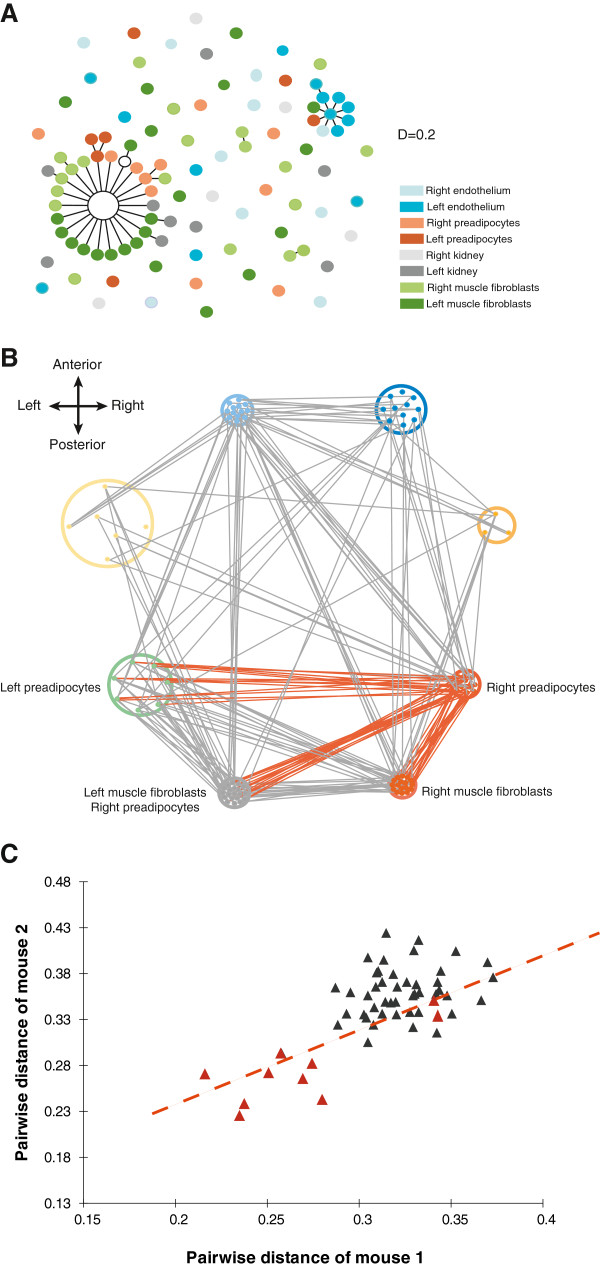
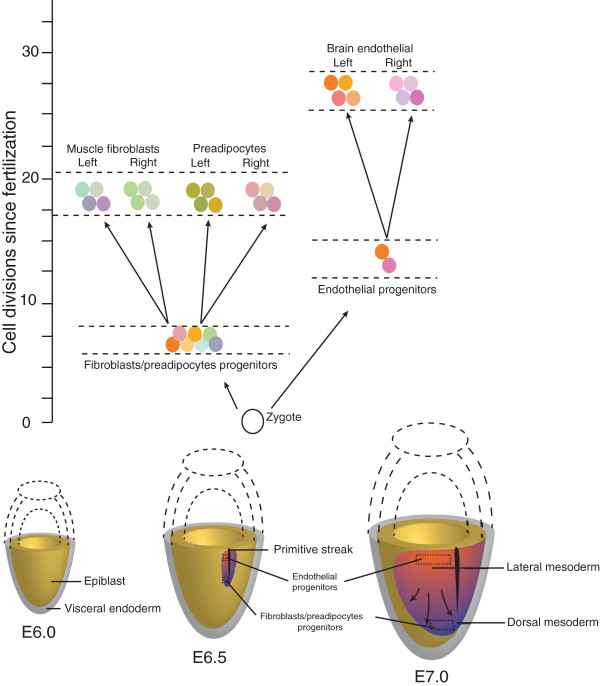
Conclusions: We find that during mouse development, muscle and fat arise from a mixed progenitor cell pool in the germ layer, but, contrastingly, vascular endothelium in brain derives from a smaller source of progenitor cells. Additionally, formation of tissue primordia is marked by establishment of left and right lateral compartments, with restricted cell migration between divisions. We quantitatively demonstrate that development represents a combination of stochastic and deterministic events, offering insight into how chance influences normal development and may give rise to birth defects.
Figures
Similar articles
-
Phylogenetic analysis of developmental and postnatal mouse cell lineages.Evol Dev. 2010 Jan-Feb;12(1):84-94. doi: 10.1111/j.1525-142X.2009.00393.x. Evol Dev. 2010. PMID: 20156285 Free PMC article.
-
A phylogenetic approach to mapping cell fate.Curr Top Dev Biol. 2007;79:157-84. doi: 10.1016/S0070-2153(06)79006-8. Curr Top Dev Biol. 2007. PMID: 17498550 Review.
-
Phylogenetic fate mapping.Proc Natl Acad Sci U S A. 2006 Apr 4;103(14):5448-53. doi: 10.1073/pnas.0601265103. Epub 2006 Mar 28. Proc Natl Acad Sci U S A. 2006. PMID: 16569691 Free PMC article.
-
Phylogenetic fate mapping: theoretical and experimental studies applied to the development of mouse fibroblasts.Genetics. 2008 Feb;178(2):967-77. doi: 10.1534/genetics.107.081018. Epub 2008 Feb 3. Genetics. 2008. PMID: 18245843 Free PMC article.
-
The developmental basis for germline mosaicism in mouse and Drosophila melanogaster.Genetica. 1998;102-103(1-6):421-43. Genetica. 1998. PMID: 9720293 Review.
Cited by
-
PolyG-DS: An ultrasensitive polyguanine tract-profiling method to detect clonal expansions and trace cell lineage.Proc Natl Acad Sci U S A. 2021 Aug 3;118(31):e2023373118. doi: 10.1073/pnas.2023373118. Proc Natl Acad Sci U S A. 2021. PMID: 34330826 Free PMC article.
-
A metabolic perspective of Peto's paradox and cancer.Philos Trans R Soc Lond B Biol Sci. 2015 Jul 19;370(1673):20140223. doi: 10.1098/rstb.2014.0223. Philos Trans R Soc Lond B Biol Sci. 2015. PMID: 26056367 Free PMC article. Review.
-
Single-cell sequencing-based technologies will revolutionize whole-organism science.Nat Rev Genet. 2013 Sep;14(9):618-30. doi: 10.1038/nrg3542. Epub 2013 Jul 30. Nat Rev Genet. 2013. PMID: 23897237 Review.
-
High-throughput dense reconstruction of cell lineages.Open Biol. 2019 Dec;9(12):190229. doi: 10.1098/rsob.190229. Epub 2019 Dec 11. Open Biol. 2019. PMID: 31822210 Free PMC article.
-
CRISPR-Cas9-targeted fragmentation and selective sequencing enable massively parallel microsatellite analysis.Nat Commun. 2017 Feb 7;8:14291. doi: 10.1038/ncomms14291. Nat Commun. 2017. PMID: 28169275 Free PMC article.
References
-
- Silver LM. Mouse Genetics. Concepts and Applications. Oxford University Press, Oxford; 1995.
-
- Mac Auley A, Werb Z, Mirkes PE. Characterization of the unusually rapid cell cycles during rat gastrulation. Development. 1993;117(3):873–883. - PubMed
Publication types
MeSH terms
Grants and funding
LinkOut - more resources
Full Text Sources
Other Literature Sources
Molecular Biology Databases
