. 2013 Apr 18;121(16):3216-27.
doi: 10.1182/blood-2011-10-385252. Epub 2013 Jan 17.

MASL1 induces erythroid differentiation in human erythropoietin-dependent CD34+ cells through the Raf/MEK/ERK pathway

Affiliations

MASL1 induces erythroid differentiation in human erythropoietin-dependent CD34+ cells through the Raf/MEK/ERK pathway

Chutima Kumkhaek et al. Blood. .

Abstract

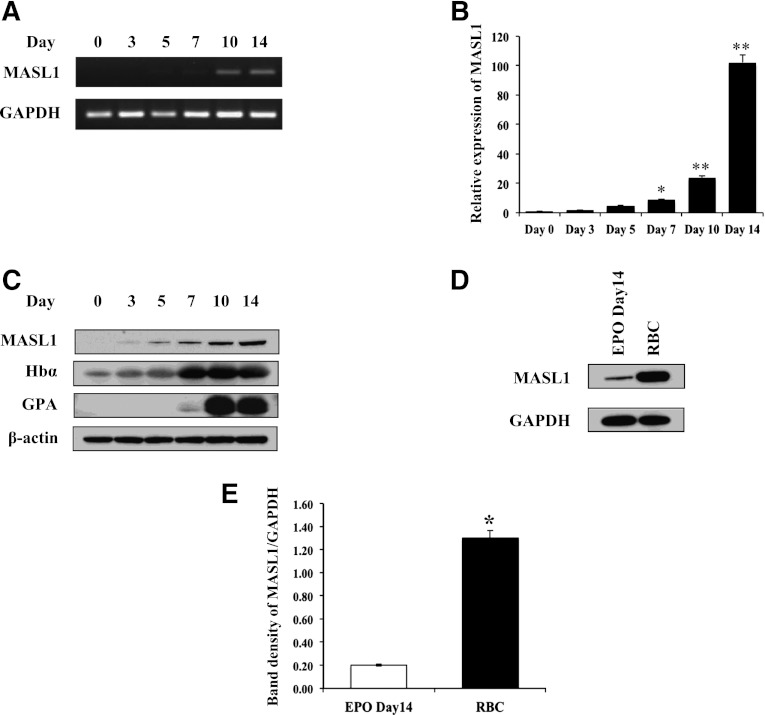
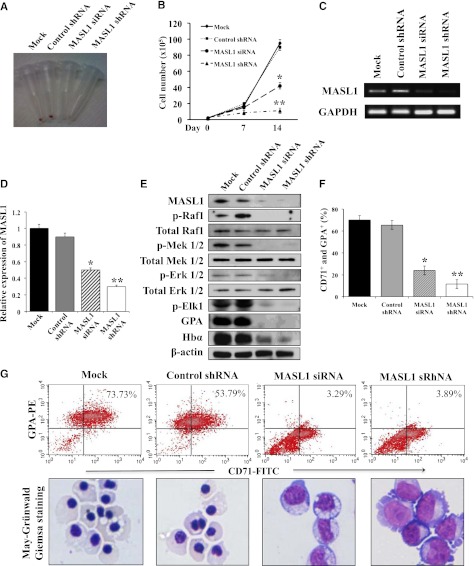
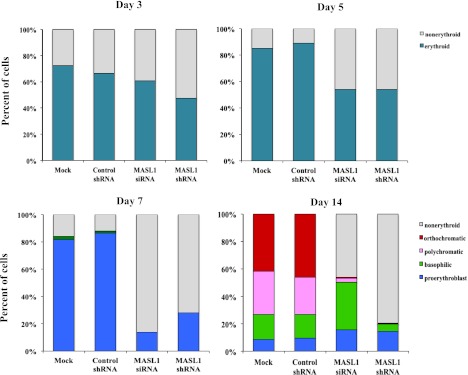
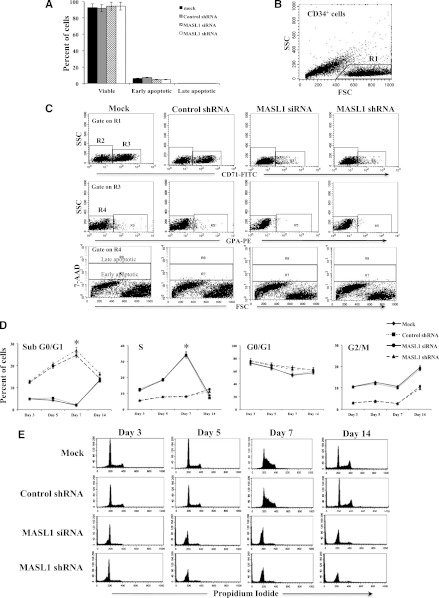
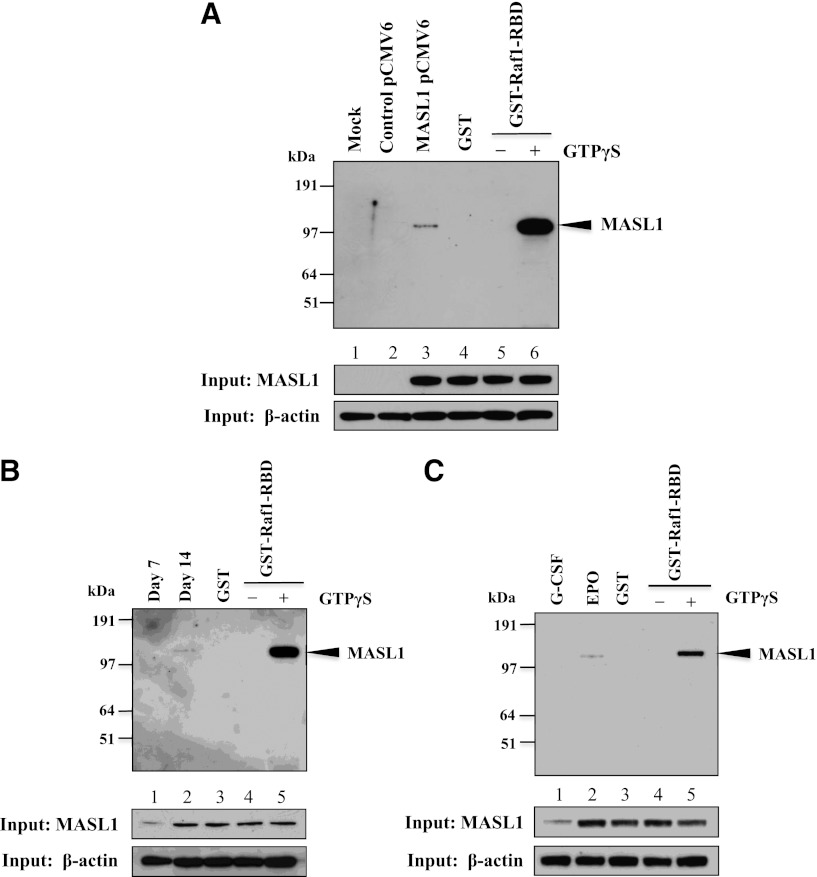
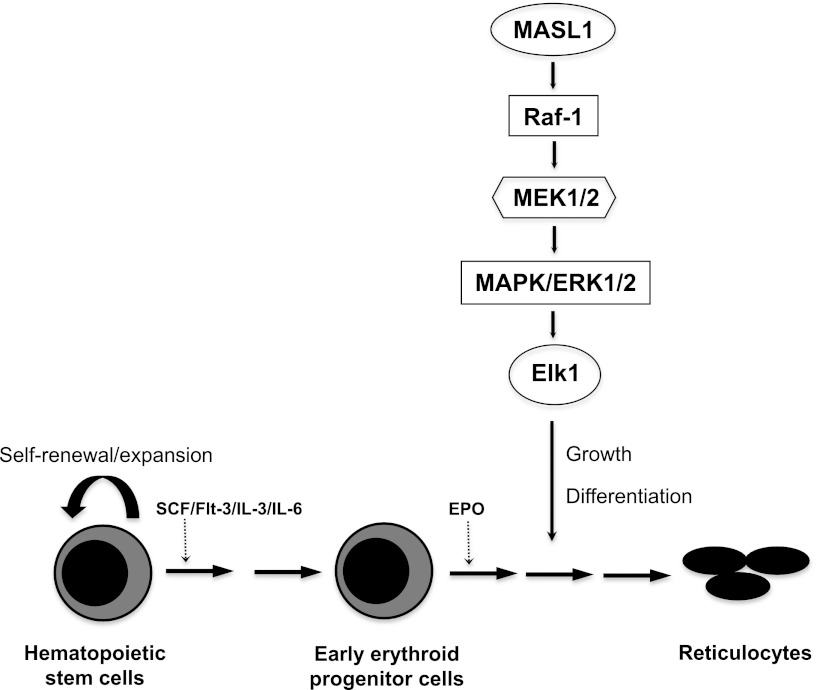
Human erythropoiesis is a dynamic and complex multistep process involving differentiation of early erythroid progenitors into enucleated RBCs. The mechanisms underlying erythropoiesis still remain incompletely understood. We previously demonstrated that erythropoietin-stimulated clone-1, which is selectively expressed in normal human erythroid-lineage cells, shares 99.5% identity with malignant fibrous histiocytoma-amplified sequences with leucine-rich tandem repeats 1 (MASL1). In this study, we hypothesized that the MASL1 gene plays a role in erythroid differentiation, and used a human erythroid cell culture system to explore this concept. MASL1 mRNA and protein expression levels were significantly increased during the erythroid differentiation of CD34(+) cells following erythropoietin (EPO) treatment. Conversely, MASL1 knockdown reduced erythroid differentiation in EPO-treated CD34(+) cells. In addition, MASL1 knockdown interrupted the Raf/MEK/ERK signaling pathway in CD34(+) cells. MASL1 mutant-transfected CD34(+) cells also showed decreased erythroid differentiation. Furthermore, inhibition of the SH3 domain of Son of Sevenless, which is an upstream adapter protein in EPO-induced erythroid differentiation, also reduced MASL1 expression and phosphorylation of Raf/MEK/ERK kinases that consequently reduced erythroid differentiation of EPO-induced CD34(+) cells. Importantly, we also demonstrated that MASL1 interacts physically with Raf1. Taken together, our data provide novel insights into MASL1 regulation of erythropoiesis through the Raf/MEK/ERK pathway.


Figures

Figure 1
Figure 1
MASL1 expression is upregulated during primary human CD34+ cell erythroid differentiation and is an abundant protein in human red blood cells (RBCs). Human peripheral blood CD34+ cells were expanded for 6 days and were then induced to differentiate by EPO treatment during a 14-day period. (A) MASL1 gene expression was examined in CD34+ cells at day 0, 3, 5, 7, 10, and 14 after EPO treatment by semiquantitative RT-PCR. GAPDH was used as an internal control. (B) Mean relative MASL1 expression levels shown as fold induction compared with levels in CD34+ cells at day 0 by qRT-PCR. Values were normalized to the expression level of the housekeeping gene GAPDH. Error bars represent the SD from 3 individual experiments; *P < .05; **P < .01. (C) Western-blot analysis of protein lysates of EPO-induced CD34+ cells using anti-MASL1, hemoglobin-α, and GPA antibodies. β-actin was used as an internal control. (D) Western-blot analysis of protein lysates prepared from CD34+ cells at day 14 of EPO-induced differentiation (EPO Day 14) and human RBCs. GAPDH was used as an internal control. (E) Mean relative MASL1 protein expression level normalized to GAPDH. Error bars represent the SD from 3 individual experiments; *P < .05.
Figure 2
Figure 2
Knockdown of MASL1 reduces erythroid differentiation in human erythroid progenitor CD34+ cells. (A) Cell pellets at day 14 of EPO-induced erythroid differentiation for mock-, control shRNA-, MASL1 siRNA-, or MASL1 shRNA-transfected CD34+ cells. Induced erythroid differentiation is evident by the pink-red cell pellets. (B) Cell counts per mL in culture at day 0, 7, and 14 of EPO-induced erythroid differentiation for mock-, control shRNA-, MASL1 siRNA-, or MASL1 shRNA-transfected CD34+ cells. Error bars represent the SD from 3 individual experiments; *P < .05; **P < .01. (C) Semiquantitative RT-PCR of MASL1 mRNA expression in mock-, control shRNA-, MASL1 siRNA-, or MASL1 shRNA-transfected CD34+ cells at day 14 of EPO-induced differentiation. GAPDH was used as an internal control. (D) qRT-PCR analysis of MASL1 gene expression in mock-, control shRNA-, MASL1 siRNA-, or MASL1 shRNA-transfected CD34+ cells. Mean relative MASL1 expression levels shown as fold induction compared with levels in mock-transfected CD34+ cells at day 14 of EPO-induced differentiation. Values were normalized to the expression level of the housekeeping gene GAPDH. Error bars represent the SD from 3 individual experiments; *P < .05; **P < .01. (E) Western-blot analysis of protein lysates prepared from mock-, control shRNA-, MASL1 siRNA-, or MASL1 shRNA-transfected CD34+ cells at day 14 of EPO-induced differentiation. β-actin was used as an internal control. (F) Flow cytometry analysis of CD71+ and GPA+ expression in mock-, control shRNA-, MASL1 siRNA-, or MASL1 shRNA-transfected CD34+ cells at day 14 of EPO-induced differentiation. Error bars represent the SD from 3 individual experiments; *P < .05; **P < .01. (G) (Top), representative density plots for data presented in F. CD34+ cells were stained with FITC-conjugated anti-CD71 and PE-conjugated anti-GPA monoclonal antibodies. The percent of CD71+ and GPA+ cells is labeled on each density plot. (Bottom), morphology of cells corresponding to flow-cytometric analysis obtained by May-Grünwald-Giemsa staining (original magnification ×20). Results are representative of 3 independent experiments.
Figure 3
Figure 3
Nonerythroid cells accumulate in MASL1-knockdown CD34+ cells following EPO-induced erythroid differentiation. A hematopathologist, blinded to experimental details, reviewed all coded slides and quantitated myeloid and erythroid cells at day 3, 5, 7, and 14 of EPO-induced erythroid differentiation in mock-, control shRNA-, MASL1 siRNA-, or MASL1 shRNA-transfected CD34+ cells. More than 200 cells were scored for each sample in triplicate individual experiments. The data represent the mean values of 3 independent experiments.
Figure 4
Figure 4
MASL1 knockdown in CD34+ cells does not alter cell survival within the CD71+ GPA- subpopulation at day 3 of EPO-induced erythroid differentiation but causes cell-cycle arrest in all CD34+ cells during erythroid differentiation. (A) Mean percentages from flow cytometry analysis of 7-AAD- (viable), 7-AADdim (early apoptotic), and 7-AADbright (late apoptotic) in mock-, control shRNA-, MASL1 siRNA-, or MASL1 shRNA-transfected CD71+GPA- subpopulation cells at day 3 of EPO-induced differentiation. Error bars represent the SD from 3 individual experiments. (B) Scattergram of forward scatter (FSC) vs right-angle side scatter (SSC), to allow gating on CD34+ cells by excluding cell debris (R1). (C) Representative scattergram for mock-, control shRNA-, and MASL1-knockdown CD34+ cells of SSC vs anti-CD71 fluorescence gated on R1 to allow gating on CD71- (R2) or CD71+ (R3). (Middle) representative scattergram for mock-, control shRNA-, and MASL1-knockdown CD34+ cells of SSC vs anti-GPA fluorescence gated on R3 to allow gating on GPA- (R4) or GPA+ (R5) and lower panel is representative scattergram of FSC vs 7-AAD fluorescence gated on R4, showing 7-AADbright (late apoptotic), 7-AADdim (early apoptotic), and 7-AAD- (viable) within CD71+ GPA- cells on day 3 of differentiation. (D) Cell-cycle distribution of mock-, control shRNA-, and MASL1-knockdown CD34+ cells at day 3, 5, 7, and 14 of EPO-induced differentiation analyzed by propidium iodide staining and flow cytometry. The data are expressed as mean percentage of sub G0/G1, G0/G1, S, and G2/M phase cells. Error bars represent the SD from 3 independent experiments; *P < .05. (E) Representative histogram for data presented in D.
Figure 5
Figure 5
MASL1 physically interacts with Raf1. (A) 239T cells were transfected with myc-DDK-tagged MASL1-pCMV6-Entry plasmid and collected for protein lysates 48 hours after transfection. The protein lysates were subjected to pull-down with GST-Raf1-RBD coupled to glutathione resin and the bound proteins were analyzed by western blot using anti-MASL1 antibody (top). (Lane 1), mock-transfected 293T cell lysate pulled-down with GST-Raf1-RBD (Mock). (Lane 2), control vector-transfected 293T cell lysate pulled-down with GST-Raf1-RBD (Control pCMV6). (Lane 3), myc-DDK-tagged MASL1-transfected 293T cell lysate pulled-down with GST-Raf1-RBD (MASL1 pCMV6). (Lane 4), GTPγS-treated myc-DDK-tagged MASL1-transfected 293T cell lysate pulled-down with GST alone (negative control) (GST). (Lane 5), GDP-treated myc-DDK-tagged MASL1-transfected 293T cell lysate pull-down (inactivated-MASL1 control). (Lane 6), GTPγS-treated myc-DDK-tagged MASL1-transfected 293T cell lysate pull-down (activated-MASL1 control). (Bottom 2 panels), expression levels of MASL1 and β-actin (as an internal control) in 10% of input samples. (B) CD34+ cells were induced to differentiate by EPO treatment of 14 days. At day 7 (Lane 1) and 14 (Lane 2) of differentiation, protein lysates were subjected to pull-down with GST-Raf1-RBD and then western blot with anti-MASL1 antibody. (Lane 3), EPO-induced CD34+ cells at day 14 of differentiation protein lysate pulled-down with GST alone (negative control). (Lane 4), GDP-treated EPO-induced CD34+ cells at day 14 of differentiation protein lysate pull-down (inactivated-MASL1 control). (Lane 5), GTPγS-treated EPO-induced CD34+ cells at day 14 of differentiation protein lysate pull-down (activated-MASL1 control). (Bottom 2 panels), expression levels of MASL1 and β-actin (as an internal control) in 10% of input samples. (C) CD34+ cells were induced to differentiate by G-CSF (Lane 1) or EPO (Lane 2) treatment of 14 days. The protein lysates were subjected to pull-down with GST-Raf1-RBD and then western blot with anti-MASL1 antibody. (Lane 3), EPO-induced CD34+ cells at day 14 of differentiation protein lysate pulled-down with GST alone (negative control). (Lane 4), GDP-treated EPO-induced CD34+ cells at day 14 of differentiation protein lysate pull-down (inactivated-MASL1 control). (Lane 5), GTPγS-treated EPO-induced CD34+ cells at day 14 of differentiation protein lysate pull-down (activated-MASL1 control). The lower 2 panels show expression levels of MASL1 and β-actin (as an internal control) in 10% of input samples. Minus (−) and Plus (+) indicate the addition of GDP or GTPγS, respectively.
Figure 6
Figure 6
Proposed model for MASL1 involvement in the Raf/MEK/ERK pathway during erythropoiesis. MASL1 induces erythroid differentiation through the Raf/MEK/ERK pathway. EPO, erythropoietin; SCF, stem cell factor.

Comment in

  • Another path to ERK activation.
    Ney PA. Ney PA. Blood. 2013 Apr 18;121(16):3064-5. doi: 10.1182/blood-2013-02-480459. Blood. 2013. PMID: 23599259 No abstract available.

Similar articles

Cited by

References

    1. Orkin SH. Diversification of haematopoietic stem cells to specific lineages. Nat Rev Genet. 2000;1(1):57–64. - PubMed
    1. Cantor AB, Orkin SH. Transcriptional regulation of erythropoiesis: an affair involving multiple partners. Oncogene. 2002;21(21):3368–3376. - PubMed
    1. Johnson L, Greenbaum D, Cichowski K, et al. K-ras is an essential gene in the mouse with partial functional overlap with N-ras. Genes Dev. 1997;11(19):2468–2481. - PMC - PubMed
    1. Zhang J, Lodish HF. Constitutive activation of the MEK/ERK pathway mediates all effects of oncogenic H-ras expression in primary erythroid progenitors. Blood. 2004;104(6):1679–1687. - PubMed
    1. Zhang J, Liu Y, Beard C, et al. Expression of oncogenic K-ras from its endogenous promoter leads to a partial block of erythroid differentiation and hyperactivation of cytokine-dependent signaling pathways. Blood. 2007;109(12):5238–5241. - PMC - PubMed

Publication types

MeSH terms