. 2013 Apr;9(4):528-37.
doi: 10.4161/auto.23484. Epub 2013 Jan 17.

ATG5 regulates plasma cell differentiation

Affiliations

ATG5 regulates plasma cell differentiation

Kara L Conway et al. Autophagy. 2013 Apr.

Abstract

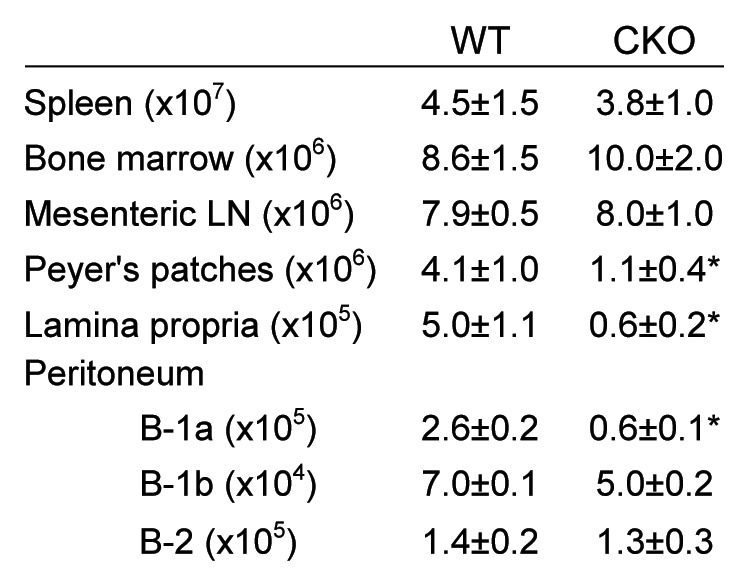
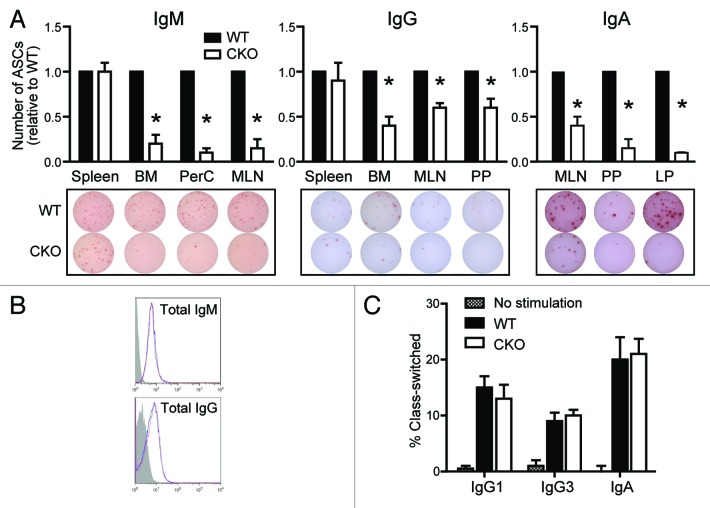
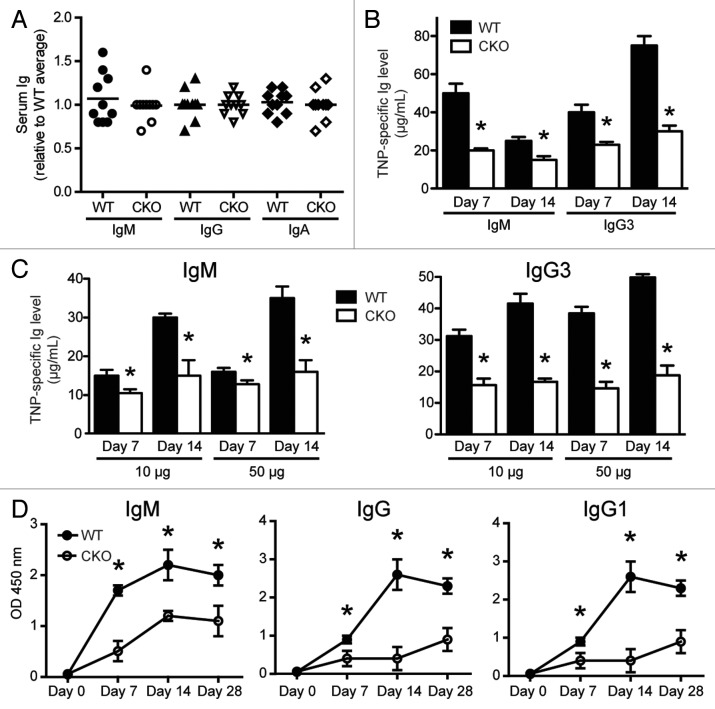
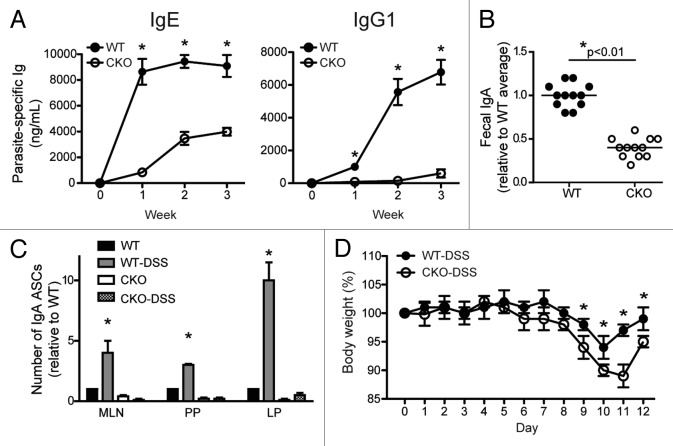
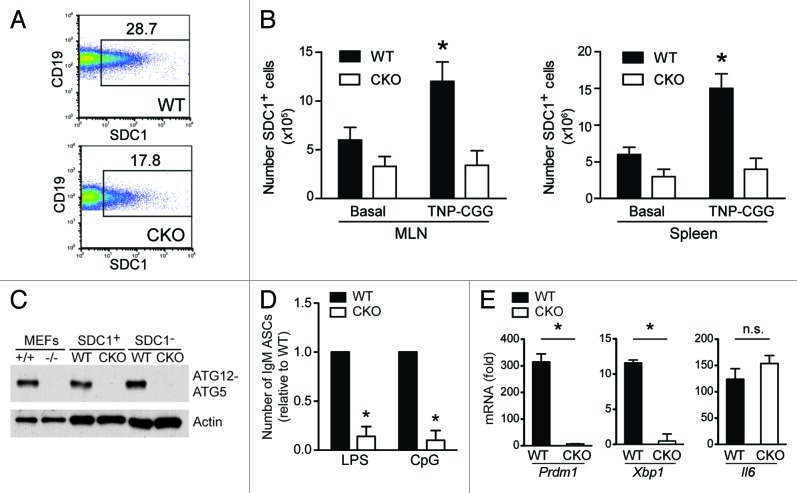
Autophagy is a conserved homeostatic process in which cytoplasmic contents are degraded and recycled. Two ubiquitin-like conjugation pathways are required for the generation of autophagosomes, and ATG5 is necessary for both of these processes. Studies of mice deficient in ATG5 reveal a key role for autophagy in T lymphocyte function, as well as in B cell development and B-1a B cell maintenance. However, the role of autophagy genes in B cell function and antibody production has not been described. Using mice in which Atg5 is conditionally deleted in B lymphocytes, we showed here that this autophagy gene is essential for plasma cell homeostasis. In the absence of B cell ATG5 expression, antibody responses were significantly diminished during antigen-specific immunization, parasitic infection and mucosal inflammation. Atg5-deficient B cells maintained the ability to produce immunoglobulin and undergo class-switch recombination, yet had impaired SDC1 expression, significantly decreased antibody secretion in response to toll-like receptor ligands, and an inability to upregulate plasma cell transcription factors. These results build upon previous data demonstrating a role for ATG5 in early B cell development, illustrating its importance in late B cell activation and subsequent plasma cell differentiation.

Keywords: ATG5; B lymphocytes; antibody secretion; immunity; plasma cell differentiation.


Figures

None
Figure 1. B lymphocyte cell numbers in immune tissues. B220+CD19+ B lymphocytes were quantified via flow cytometry. Peritoneal B cell subsets were defined as follows: B-1a (B220low, IgDlow, IgM+ and CD5+), B-1b (B220low, IgDlow, IgM+ and CD5-) and B-2 (B220high, IgD+, IgM+ and CD5-). Significance was determined using Student’s t test. *p < 0.001 compared with WT; n = 20 per group.
None
Figure 2.Atg5-deficient B cells have decreased Ig secretion, despite the ability to express Ig and undergo CSR. (A) Purified B cells were cultured on anti-Ig coated ELISpot plates and antibody-secreting cells (ASCs) were enumerated after 24 h. Numbers of IgM ASCs (top left), IgG ASCs (top middle) and IgA ASCs (top right) are shown relative to the number of ASCs present in each WT mouse tissue. *p < 0.001; n ≥ 10 per group. Representative ELISpot wells are shown for each tissue (bottom). BM, bone marrow; PerC, peritoneal cavity; MLN, mesenteric lymph node; PP, Peyer’s patches; LP, lamina propria. (B) Total IgM and IgG expression levels were quantified by flow cytometry. Representative histograms from MLN display WT (blue line) and CKO (red line) Ig distributions in CD19+ cells. Isotype control staining is shown in gray. (C) Purified naïve B cells were induced to undergo CSR to IgG1, IgG3 or IgA. Percentages of class-switched B cells were determined via flow cytometry after 4 d. No significant differences were observed via Student’s t-test.
None
Figure 3.Atg5-deficient B cells are unable to efficiently mount antigen-specific responses. (A) Serum from age-matched littermates was harvested and IgM, IgG and IgA levels were determined by ELISA (n = 10 per group). Each mouse is individually displayed relative to the average Ig amount in WT mice. (B) Age-matched littermates were immunized i.p. with TNP-LPS. Serum was harvested on days 7 and 14 and anti-TNP IgM and IgG3 levels were determined by ELISA. *p < 0.001; n = 10 per group. (C) Age-matched littermates were immunized i.p. with TNP-Ficoll at indicated doses. Serum was harvested on days 7 and 14 and anti-TNP IgM and IgG3 levels were determined by ELISA. *p < 0.01; n = 10 per group. (D) Age-matched littermates were immunized i.p. with TNP-CGG on day 0 and day 14. Serum was harvested on days 0, 7, 14 and 28, and TNP-specific Ig levels were detected via ELISA. ELISA values plotted represent the average OD450 reading. *p < 0.01; n = 5 per group. Statistics were calculated using Student’s t-test.
None
Figure 4. B cell ATG5 expression is required for appropriate antibody responses during intestinal infection and intestinal inflammation. (A) Age- and weight-matched mice were inoculated with 200 third-stage H. polygyrus larvae. Parasite-specific IgE and IgG1 were quantified by ELISA 1, 2 and 3 weeks post-infection. *p < 0.01; n = 5 per group. (B) Fecal pellets were harvested from age-matched littermates, weighed, and homogenized in PBS at volumes commensurate with the pellet weight. Supernatants were subjected to IgA-specific ELISA for analysis. *p < 0.01; n = 10 per group. Fecal IgA data points shown here correlate to the mice displayed in Figure 2A depicting total serum Ig. (C) Age- and weight-matched mice were given 3% DSS ad libitum in drinking water for 7 d, followed by 5 d of regular drinking water. At day 12, B lymphocytes were isolated from MLN, PP and LP for IgA-specific ELISpot assay analysis. IgA ASCs were enumerated after 24 h and the numbers shown are relative to the number of IgA ASCs present in each tissue from WT mice that received no DSS. *p < 0.001 compared with WT without DSS; n = 7 per group. (D) Body weights plotted from DSS-treated mice in (C). *p < 0.01. Statistics were determined using Student’s t-test.
None
Figure 5.Atg5-deficient B cells are defective in plasma cell differentiation. (A) The frequency of SDC1-expressing cells was determined via flow cytometry. Representative dot plots from MLN are shown and numbers represent the percentage of CD19+ B cells expressing SDC1. (B) The number of SDC1+ cells was quantified in mesenteric lymph nodes and spleen at baseline and after TNP-CGG immunization. *p < 0.01 comparing basal to TNP-CGG immunized. (C) ATG5 deletion was confirmed by western blot. MEFs harvested from WT and Atg5-deficient mice were used as controls in lanes 1 and 2. Sorted CD19+B220+SDC1 and CD19+B220+SDC1+ populations from the mesenteric lymph nodes of WT and CKO mice were assessed. (D) CD19+B220+SDC1 cells were sorted from the MLN of WT and CKO mice and cultured with LPS (10 μg/mL) or CpG (1 μg/mL) for 48 h on ELISpot membranes. Anti-IgM antibody-secreting cells were quantified and numbers shown are relative to the number of antibody-secreting cells in WT samples. *p < 0.001; n = 6 per group. (E) Prdm1, Xbp1 and Il6 mRNA expression in sorted CD19+B220+SDC1 populations from the mesenteric lymph nodes of WT and CKO mice after 48 h of LPS stimulation. Numbers shown represent fold induction after LPS stimulation within each group. *p < 0.001 comparing fold induction in WT vs. CKO; ns = not significant; n = 6 per group.

Similar articles

Cited by

References

    1. Levine B, Mizushima N, Virgin HW. Autophagy in immunity and inflammation. Nature. 2011;469:323–35. doi: 10.1038/nature09782. - DOI - PMC - PubMed
    1. Rioux JD, Xavier RJ, Taylor KD, Silverberg MS, Goyette P, Huett A, et al. Genome-wide association study identifies new susceptibility loci for Crohn disease and implicates autophagy in disease pathogenesis. Nat Genet. 2007;39:596–604. doi: 10.1038/ng2032. - DOI - PMC - PubMed
    1. Zhou XJ, Lu XL, Lv JC, Yang HZ, Qin LX, Zhao MH, et al. Genetic association of PRDM1-ATG5 intergenic region and autophagy with systemic lupus erythematosus in a Chinese population. Ann Rheum Dis. 2011;70:1330–7. doi: 10.1136/ard.2010.140111. - DOI - PubMed
    1. Huett A, Xavier RJ. Autophagy at the gut interface: mucosal responses to stress and the consequences for inflammatory bowel diseases. Inflamm Bowel Dis. 2010;16:152–74. - PMC - PubMed
    1. Kuma A, Hatano M, Matsui M, Yamamoto A, Nakaya H, Yoshimori T, et al. The role of autophagy during the early neonatal starvation period. Nature. 2004;432:1032–6. doi: 10.1038/nature03029. - DOI - PubMed

Publication types

MeSH terms