. 2013 May;62(5):1593-601.
doi: 10.2337/db11-1593. Epub 2013 Jan 17.

Neprilysin deficiency protects against fat-induced insulin secretory dysfunction by maintaining calcium influx

Affiliations

Neprilysin deficiency protects against fat-induced insulin secretory dysfunction by maintaining calcium influx

Sakeneh Zraika et al. Diabetes. 2013 May.

Abstract

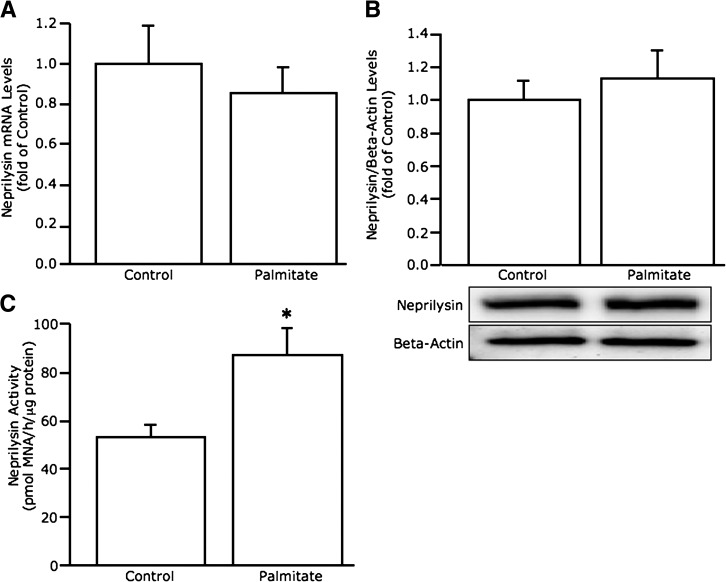
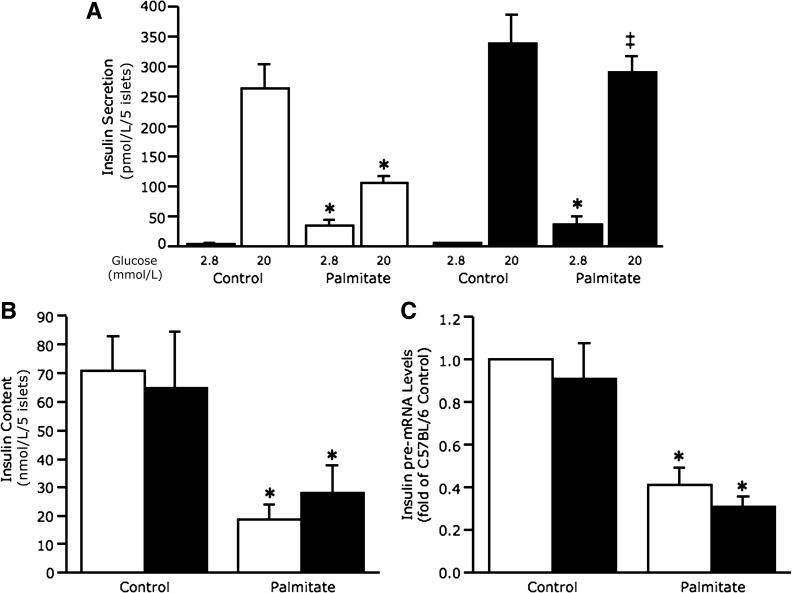
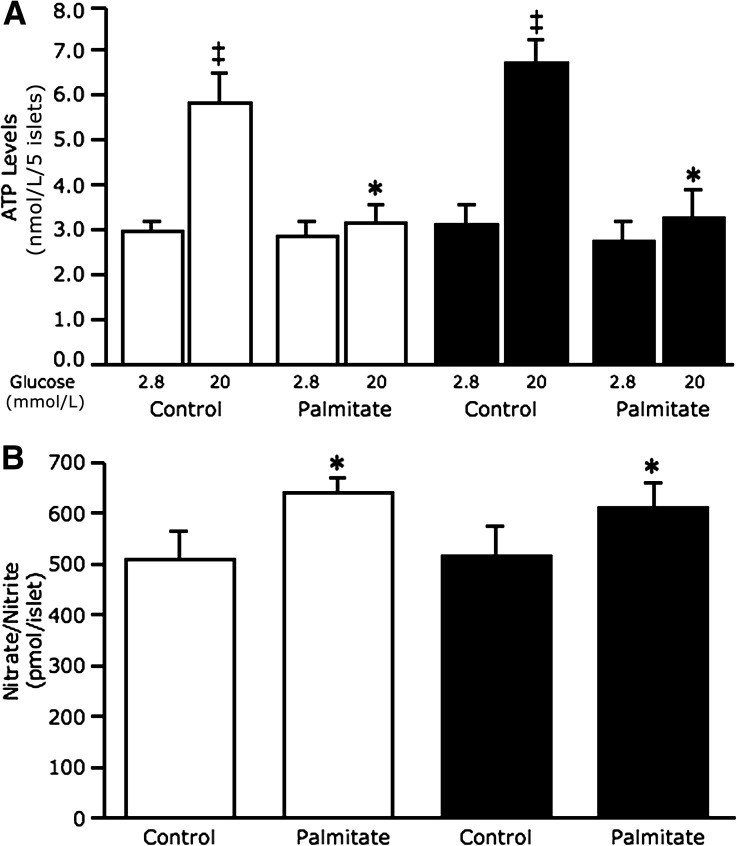
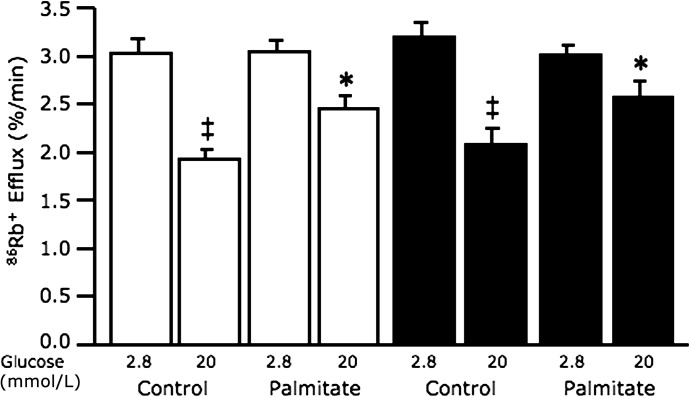
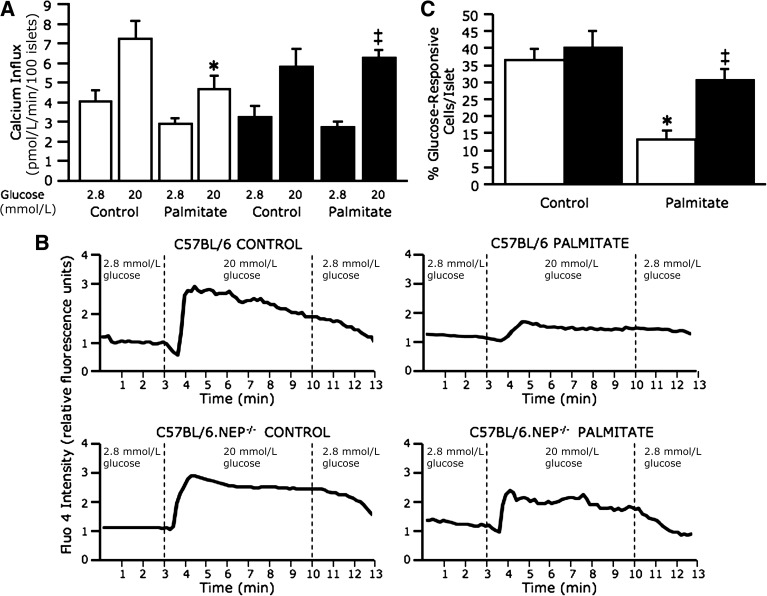
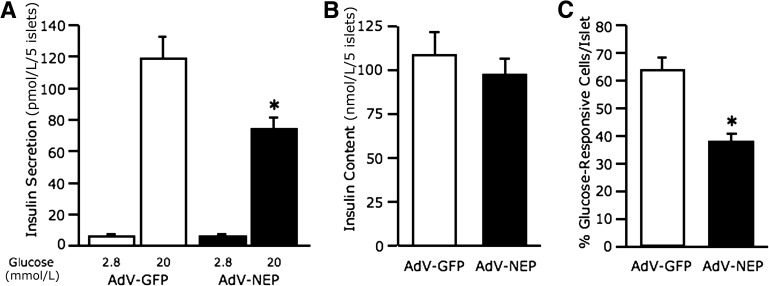
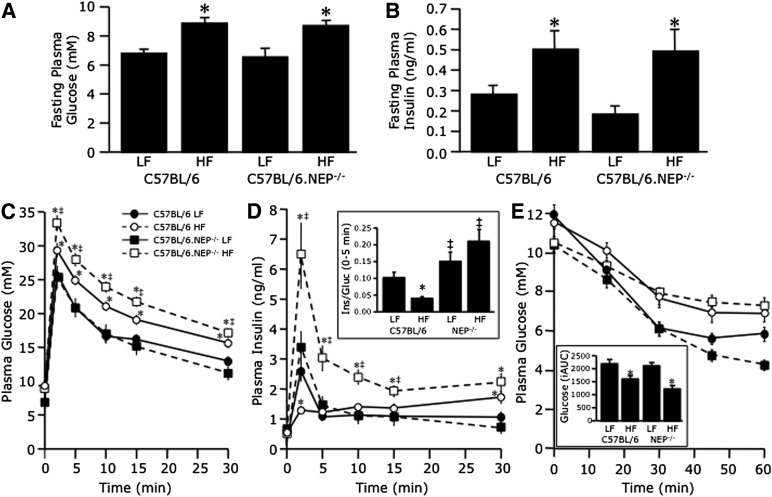
Neprilysin contributes to free fatty acid (FFA)-induced cellular dysfunction in nonislet tissues in type 2 diabetes. Here, we show for the first time that with prolonged FFA exposure, islet neprilysin is upregulated and this is associated with reduced insulin pre-mRNA and ATP levels, oxidative/nitrative stress, impaired potassium and calcium channel activities, and decreased glucose-stimulated insulin secretion (GSIS). Genetic ablation of neprilysin specifically protects against FFA-induced impairment of calcium influx and GSIS in vitro and in vivo but does not ameliorate other FFA-induced defects. Importantly, adenoviral overexpression of neprilysin in islets cultured without FFA reproduces the defects in both calcium influx and GSIS, suggesting that upregulation of neprilysin per se mediates insulin secretory dysfunction and that the mechanism for protection conferred by neprilysin deletion involves prevention of reduced calcium influx. Our findings highlight the critical nature of calcium signaling for normal insulin secretion and suggest that interventions to inhibit neprilysin may improve β-cell function in obese humans with type 2 diabetes.


Figures

FIG. 1.
FIG. 1.
Palmitate exposure increases neprilysin activity but not mRNA or protein levels in C57BL/6 islets. Neprilysin mRNA expression (A) (n = 11), protein levels (B) (n = 6; image is a representative blot), and activity (C) (n = 5) in C57BL/6 islets after 48-h culture in the absence or presence of 1 mmol/L palmitate. Data are means ± SEM. *P = 0.02 vs. control.
FIG. 2.
FIG. 2.
Neprilysin-deficient islets are protected against palmitate-induced reductions in GSIS. Insulin secretion in response to 2.8 and 20 mmol/L glucose (A) (n = 5), islet insulin content (B) (n = 5), and insulin pre-mRNA levels (C) (n = 9) from C57BL/6 and C57BL/6.NEP−/− islets after 48-h culture in the absence or presence of 1 mmol/L palmitate. White bars, C57BL/6 islets; black bars, C57BL/6.NEP−/− islets. Data are means ± SEM. *P < 0.05 vs. control; ‡P = 0.0001 vs. C57BL/6.
FIG. 3.
FIG. 3.
Neprilysin-deficient islets exposed to palmitate are not protected against reduced glucose-stimulated ATP levels or nitrative stress. ATP levels in response to 2.8 and 20 mmol/L glucose stimulation (A) (n = 5) and nitrate/nitrite levels (B) (n = 7) from C57BL/6 and C57BL/6.NEP−/− islets after 48-h culture in the absence or presence of 1 mmol/L palmitate. White bars, C57BL/6 islets; black bars, C57BL/6.NEP−/− islets. Data are means ± SEM. *P < 0.05 vs. control; ‡P < 0.005 vs. 2.8 mmol/L glucose.
FIG. 4.
FIG. 4.
Potassium efflux in response to 20 mmol/L glucose stimulation is similarly elevated in C57BL/6 and neprilysin-deficient islets after palmitate exposure. Rubidium efflux, reflecting K+ permeability, in response to 2.8 and 20 mmol/L glucose stimulation from C57BL/6 and C57BL/6.NEP−/− islets after 48-h culture in the absence or presence of 1 mmol/L palmitate. White bars, C57BL/6 islets; black bars, C57BL/6.NEP−/− islets. Data are means ± SEM; n = 5. *P < 0.05 vs. control; ‡P < 0.001 vs. 2.8 mmol/L glucose.
FIG. 5.
FIG. 5.
Neprilysin-deficient islets exposed to palmitate are protected against reduced glucose-stimulated calcium influx. Calcium influx, measured using 45Ca2+, in response to 2.8 and 20 mmol/L glucose stimulation from C57BL/6 and C57BL/6.NEP−/− islets after 48-h culture in the absence or presence of 1 mmol/L palmitate (A) (n = 5). Representative traces for calcium imaging of islets loaded with fluo-4 and perifused with 2.8 mmol/L and 20 mmol/L glucose (B). Percentage of 20 mmol/L glucose–responsive cells per C57BL/6 or C57BL/6.NEP−/− islet after 48-h culture in the absence or presence of 1 mmol/L palmitate (C) (n = 11–14 islets/group), determined as increased fluo-4 emission intensity when the perifusion solution was switched from 2.8 to 20 mmol/L glucose. White bars, C57BL/6 islets; black bars, C57BL/6.NEP−/− islets. Data are means ± SEM. *P < 0.01 vs. control; ‡P < 0.05 vs. C57BL/6.
FIG. 6.
FIG. 6.
Adenovirus-mediated upregulation of neprilysin recapitulates the impairment in GSIS and calcium influx due to palmitate exposure. Insulin secretion in response to 2.8 and 20 mmol/L glucose (A) (n = 8) and islet insulin content (B) (n = 8) from C57BL/6 islets after infection with either AdV-GFP or AdV-NEP and culture for 48 h in the absence of palmitate. Percentage of 20 mmol/L glucose-responsive cells per AdV-GFP or AdV-NEP islet after 48-h culture in the absence of 1 mmol/L palmitate (C) (n = 13–18 islets/group), determined as increased Rhod-3 emission intensity when the perifusion solution was switched from 2.8 to 20 mmol/L glucose. White bars, AdV-GFP; black bars, AdV-NEP. Data are means ± SEM. *P < 0.02 vs. AdV-GFP.
FIG. 7.
FIG. 7.
Neprilysin-deficient mice are protected against high-fat diet–induced insulin secretory dysfunction. Fasting plasma glucose (A) and insulin (B) levels and plasma glucose (C) and insulin (D) levels in response to intravenous glucose and plasma glucose levels in response to intraperitoneal insulin (E) in C57BL/6 and C57BL/6.NEP−/− mice after 12 weeks on a low-fat (LF) or high-fat (HF) diet. The inset in D shows the early insulin response to intravenous glucose calculated as a ratio of the incremental areas under the insulin and glucose curves over the first 5 min. The inset in E shows the inverse area under the curve below baseline glucose after insulin administration. Closed circles, C57BL/6 LF; open circles, C57BL/6 high fat; closed squares, C57BL/6.NEP−/− low fat; open squares, C57BL/6.NEP−/− high fat. Data are means ± SEM; n = 14–18. *P < 0.05 vs. LF; ‡P < 0.05 vs. C57BL/6.

References

    1. Kahn SE, Zraika S, Utzschneider KM, Hull RL. The beta cell lesion in type 2 diabetes: there has to be a primary functional abnormality. Diabetologia 2009;52:1003–1012 - PMC - PubMed
    1. Fraze E, Donner CC, Swislocki AL, Chiou YA, Chen YD, Reaven GM. Ambient plasma free fatty acid concentrations in noninsulin-dependent diabetes mellitus: evidence for insulin resistance. J Clin Endocrinol Metab 1985;61:807–811 - PubMed
    1. Crespin SR, Greenough WB, 3rd, Steinberg D. Stimulation of insulin secretion by long-chain free fatty acids. A direct pancreatic effect. J Clin Invest 1973;52:1979–1984 - PMC - PubMed
    1. Warnotte C, Gilon P, Nenquin M, Henquin JC. Mechanism of the stimulation of insulin release by saturated fatty acids. A study of palmitate effects in mouse beta-cells. Diabetes 1994;43:703–711 - PubMed
    1. Sako Y, Grill VE. A 48-hour lipid infusion in the rat time-dependently inhibits glucose-induced insulin secretion and B cell oxidation through a process likely coupled to fatty acid oxidation. Endocrinology 1990;127:1580–1589 - PubMed

Publication types

MeSH terms