

Epidemiology of U.S. high school sports-related ligamentous ankle injuries, 2005/06-2010/11
- PMID: 23328403
- PMCID: PMC3640618
- DOI: 10.1097/JSM.0b013e31827d21fe
Epidemiology of U.S. high school sports-related ligamentous ankle injuries, 2005/06-2010/11
Abstract
Objective: Describe ankle injury epidemiology among US high school athletes in 20 sports.
Design: Descriptive prospective epidemiology study.
Setting: Sports injury data for the 2005/06 to 2010/11 academic years were collected using an Internet-based injury surveillance system, Reporting Information Online.
Participants: A nationwide convenience sample of US high schools.
Assessment of risk factors: Injuries sustained as a function of sport and gender.
Main outcome measures: Ankle sprain rates and patterns, outcomes, and mechanisms.
Results: From 2005/06 to 2010/11, certified athletic trainers reported 5373 ankle sprains in 17,172,376 athlete exposures (AEs), for a rate of 3.13 ankle sprains per 10,000 AEs. Rates were higher for girls than for boys (rate ratio [RR], 1.25; 95% confidence interval [CI], 1.17-1.34) in gender-comparable sports and higher in competition than practice for boys (RR, 3.42; 95% CI, 3.20-3.66) and girls (RR, 2.71; 95% CI, 2.48-2.95). The anterior talofibular ligament was most commonly injured (involved in 85.3% of sprains). Overall, 49.7% of sprains resulted in loss of participation from 1 to 6 days. Although 0.5% of all ankle sprains required surgery, 6.6% of those involving the deltoid ligament also required surgery. The athletes were wearing ankle braces in 10.6% of all the sprains. The most common injury mechanism was contact with another person (42.4% of all ankle sprains).
Conclusions: Ankle sprains are a serious problem in high school sports, with high rates of recurrent injury and loss of participation from sport.
Figures
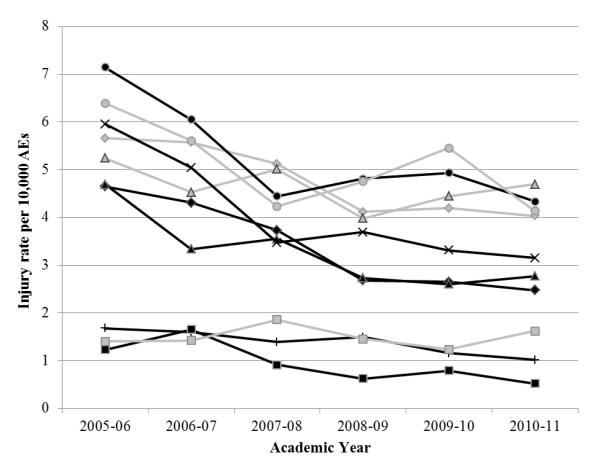
 Football ▴ Boys’ Soccer
  Girls’ Soccer × Girls’ Volleyball • Boys’ Basketball
  Girls’ Basketball + Wrestling ∎ Baseball
  Softball aReflects rates for combined original and convenience samples. b“Total,” is the total rate for combined original and convenience sample data for only the original 9 sports. cSignificant trends (see text): Total (p = 0.002), boys’ football (p = 0.006), boys’ soccer (p = 0.028), boys’ wrestling (p = 0.005), and girls’ volleyball (p = 0.015), and boys’ basketball (p = 0.041)
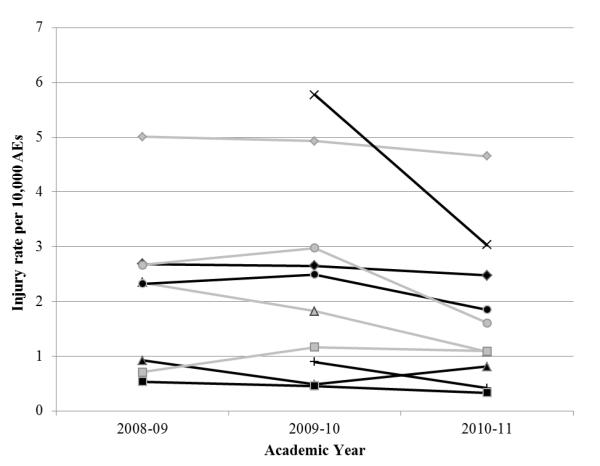
 Girls’ Field Hockey × Boys’ Volleyball • Boys’ Lacrosse
  Girls’ Lacrosse ∎ Boys’ Track and Field
  Girls’ Track and Field
  Girls’ Gymnastics + Cheerleading aBoys’ and girls’ swimming and diving not included because only 2 girls’ swimming and diving ankle sprains were recorded. b“Total” is the rate for combined original and convenience sample data for all 20 sports. cNone of these trends were significant at p = 0.05.
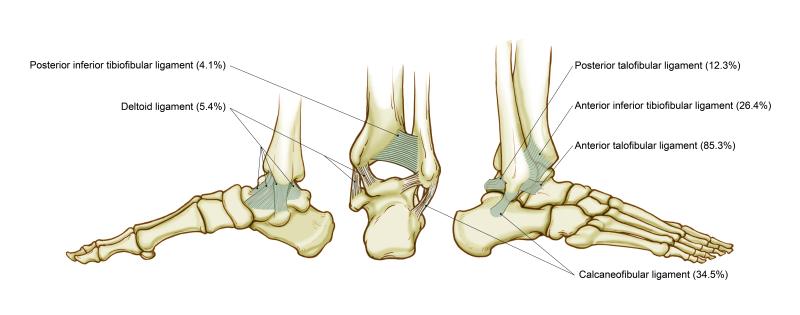
References
-
- 2010-11 high school athletics participation survey results. National Federation of State High School Associations; [Accessed February 24, 2012]. Web site. http://www.nfhs.org/content.aspx?id=3282.
-
- Enrollment status of the population 3 years old and over, by sex, age, race, Hispanic origin, foreign born, and foreign-born parentage: October 2010. United States Census Bureau; [Accessed February 24, 2012]. Web site. http://www.census.gov/hhes/school/data/cps/2010/tables.html.
-
- The case for high school activities. National Federation of State High School Associations; [Accessed July 12, 2011]. Web site. https://www.nchsaa.org/intranet/downloadManagerControl.php?mode=getFile&....
-
- Fong DT, Hong Y, Chan LK, et al. A systematic review on ankle injury and ankle sprain in sports. Sports Med. 2007;37:73–94. - PubMed
Publication types
MeSH terms
Grants and funding
LinkOut - more resources
Full Text Sources
Other Literature Sources
Medical
