. 2013 Jan 14;23(1):48-62.
doi: 10.1016/j.ccr.2012.12.001.

NEK2 induces drug resistance mainly through activation of efflux drug pumps and is associated with poor prognosis in myeloma and other cancers

Affiliations

NEK2 induces drug resistance mainly through activation of efflux drug pumps and is associated with poor prognosis in myeloma and other cancers

Wen Zhou et al. Cancer Cell. .

Abstract

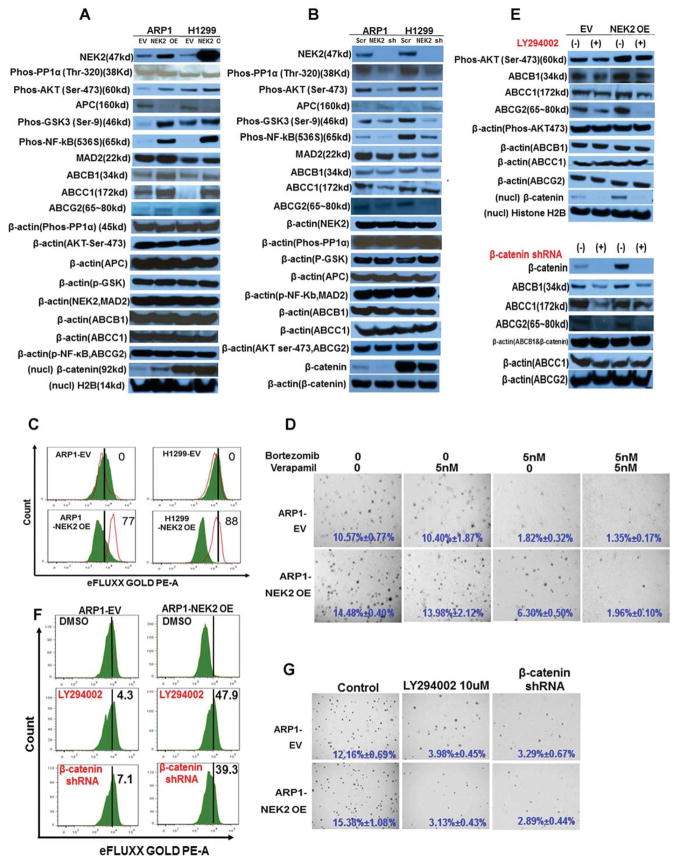
Using sequential gene expression profiling (GEP) samples, we defined a major functional group related to drug resistance that contains chromosomal instability (CIN) genes. One CIN gene in particular, NEK2, was highly correlated with drug resistance, rapid relapse, and poor outcome in multiple cancers. Overexpressing NEK2 in cancer cells resulted in enhanced CIN, cell proliferation and drug resistance, while targeting NEK2 by NEK2 shRNA overcame cancer cell drug resistance and induced apoptosis in vitro and in a xenograft myeloma mouse model. High expression of NEK2 induced drug resistance mainly through activation of the efflux pumps. Thus, NEK2 represents a strong predictor for drug resistance and poor prognosis in cancer and could be an important target for cancer therapy.


Conflict of interest statement

The authors declare no conflict – of – interest disclosure.

Figures

Figure 1
Figure 1. Identification of genes related to myeloma drug-resistance and disease relapse
(A & B) Heat maps of the 56 differentially expressed genes in paired myeloma samples at baseline and either after chemotherapy (n = 19) (A) or at relapse (n = 51) (B). Patient samples were plotted on the vertical axis and the gene probe sets were listed on top along the horizontal axis. Please also see Table S1. (C) A complete sample set (at diagnosis, pre-1st, pre-2nd and post-2nd transplants) was available for 9 of the 19 patients. The expression of CIN genes increased significantly in myeloma cells during chemotherapy, suggesting a strong relationship with drug resistance. Red color for a gene indicates expression above the median and blue color indicates expression below the median. (D) Gene expression clustergram of 10 CIN genes in plasma cells from 22 healthy subjects (NPC), 44 subjects with MGUS, 351 patients with newly diagnosed MM and 9 human MM cell lines (MMCL). Samples within myeloma risk groups were ordered so that the predicted risk increases continuously from left to right. (E & F) Kaplan-Meier analyses showed that the top 10% of uniformly-treated MM patients with high CIN signatures had a significantly inferior event-free survival (E) and overall survival (F).
Figure 2
Figure 2. High NEK2 expression is linked to a poor prognosis in myeloma
(A & B) Kaplan-Meier analyses of event-free survival (A) and overall survival (B) revealed inferior outcomes among the 47 patients with NEK2 high-expression compared with the remaining 304 patients with NEK2 low-expression in the TT2 trial. (C) Kaplan-Meier analysis of post-relapse survival was shown in relation to NEK2 expression determined by GEP. High expression of NEK2 conferred a short post-relapse survival. (D & E) Kaplan-Meier analyses of event-free survival (D) and overall survival (E) revealed an inferior outcome among the 25 patients with NEK2 high-expression compared with the remaining 187 patients with NEK2 low-expression in our TT3 trial. Please also see Figure S1.
Figure 3
Figure 3. Over-expression of NEK2 promotes cancer cell proliferation and drug resistance
(A) Western blots showed increased NEK2 expression in the cancer cell lines ARP1, KMS28PE, OCI-MY5, H1299, and MCF7, and normal fibroblasts BJ after transfection with NEK2-cDNA. Empty vector (EV)-transfected cells served as controls. (B & C) Over-expression of NEK2 into cancer cell lines and normal cells increased cell proliferation in normal and cancer cells. All results were expressed as means ± SD of 3 independent experiments. (D) The cancer cells were fed with medium with or without bortezomib, doxorubicin and etoposide in plates with single layer agar cultures. Drug treatments decreased significantly colony efficiency values (shown on the figure) in the control group, but decreased much less in the NEK2 over-expressing group. The assay was done in triplicate and the representative images of colonies of ARP1-EV and ARP1-NEK2 OE were shown (4x). Note: we performed all clonogenic assays at the same time for the Figure 6G, so the controls used in this Figure and Figure 6G are the same. (E) ARP1 EV cells showed the sensitivity to all the anti-cancer drugs using the standard apoptotic assay, and the right shifted peak indicates cells undergoing apoptosis. More apoptotic cells were seen, associated with a greater shifted to the right when higher drug concentrations were applied. The ARP1 cells with NEK2 over-expression showed only a weak right shifted peak even with high dose treatment. (F–I) F & H showed double stains for CD138 antibody noted as brown membrane pattern as well as for Ki67 noted as red nuclear staining pattern using immunohistochemical staining. G & I disclosed stains for NEK2 with brown nuclear staining pattern. F & G represented one case showing sheets of plasma cells with (F) approximately 5% of CD138 positive plasma cells showing red nuclear staining for Ki-67, while (G) NEK2 was positive in half the cells. (H) Neoplastic CD138 positive plasma cells showed 20–30% positive nuclear staining for Ki67, while (I) these cells were completely negative for NEK2. Note that numerous cells in Figure 3I showed positive nuclear Ki67 staining, but lacked CD138 staining, thus reflecting normal hematopoietic cells. Scale bars, 50 μm. (J & K) showed double stains for CD138 noted as red membrane pattern as well as for NEK2 noted as brown nuclear staining pattern in post-2nd ASCT samples. Scale bars, 50 μm. Please also see Figure S2.
Figure 4
Figure 4. Over-expression of NEK2 induces chromosomal instability
(A, B, E, & F) Array-CGH showed that genome-wide gains and losses in ARP1 (A & B) and H1299 (E, & F) cells transfected with empty vector (EV) vs. parental (WT) (A & E) and NEK2 cDNA (NEK2) vs. parental (B & F). Dots represent the log2 ratio of the intensities for each CGH microarray probe plotted vs. the chromosome position. Yellow lines represented the estimated mean of each segment by DNAcopy. (C) Magnification of a segment of chromosome 4 showed no gain or loss in ARP1 EV vs. WT, but losses in ARP1 NEK2 vs. WT. (D) FISH confirmed the loss of 4q21.23 in the NEK2 over-expressing ARP1 cells (3 copies) compared to WT ARP1 cells (4 copies) and the ARP1-EV (4 copies). The control probe CEP10 (D: orange) showed no difference in any of the three ARP1. Scale bars, 10 μm. (G) Magnification of a segment of chromosome 21 showed losses in the H1299 transfected with NEK2 cDNA but not in the empty vector. (H) FISH confirmed the loss of 21q22 in the NEK2 overexpressing H1299 cells (2 copies) compared to the H1299-WT cells (5 copies) and the H1299-EV (5 copies). The control probe CEP7 (H: green) showed no difference in all three H1299 lines. Scale bars, 10 μm.
Figure 5
Figure 5. Silencing NEK2 expression by shRNAs induces cancer cell growth inhibition and decreases cell vialiability
(A & B) 1.5 × 10(5) cells from the cancer cell lines ARP1, KMS28PE, OCI-MY5, H1299, and MCF7 were transfected with NEK2-shRNA and cultured for 7 days. NEK2-shRNA induced significant growth inhibition (A) and decreased cell vialibility (B). Cells transfected with scrambled (SCR) sequence served as control; results were expressed as means ± SD of 3 independent experiments. (C) Western blots confirmed that NEK2 expression was dramatically decreased in ARP1, KMS28PE, OCI-MY5, H1299, and MCF7 cancer cells transfected with NEK2 shRNA. Silencing NEK2 induced apoptosis through both death receptor-dependent (caspase 8) and –independent (caspase 9) pathways compared with SCR controls. (D) ARP1 cells were transduced with NEK2 shRNA and SCR control vectors and then injected subcutaneously into the right abdomen of NOD-Rag/null gamma mice. Viral expression was induced by the addition of doxycycline to the drinking water about 10 days after injection of tumor cells. Differences in tumor size are shown between the 2 groups of mice 24 days after injection of ARP1 cells and 14 days after addition of doxycycline. (E) Tumor volume assessments showed that mice with NEK2-shRNA had smaller tumor size than the control group. (F) In the ARP1-DR mice, the groups of 1 to 4 are the group of control (Scr), Scr+ bortezomib, NEK2-shRNA, and NEK2-shRNA + bortezomib, respectively. (G) Tumor volume assessments showed smaller tumor sizes in NEK2 shRNA treated mice than in other groups. (H) Western blots showed decreased NEK2 expression in ARP1-DR cells after NEK2 shRNA activation (groups 3 & 4). See also Figure S3.
Figure 6
Figure 6. Over-expression of NEK2 activates both the AKT and canonical Wnt signaling pathways resulting in cancer cell proliferation, drug resistance and chromosomal instability
(A) ARP1 and H1299 were transduced with either NEK2 cDNA or empty vector using lentiviral delivery system. Increased expression of phos-PP1 and phos-AKT (Ser-473), phos-GSK3, phos-NF-kB, MAD2, ABC transporter members (ABCB1, ABCC1 and ABCG2) and nuclear accumulation of β–catenin was observed by western blotting. We also observed that NEK2 induced decreased expression of APC. (B) Western blots showed that knock-down NEK2 by shRNA inhibited the activity of AKT and Wnt signaling and decreased the expression of the ABC transporter members in ARP1 and H1299 cells. (C) Flow cytometry showed that ARP1 and H1299 cells over-expressing NEK2 have a higher efflux of the hydrophilic eFluxx-ID gold fluorescent dye indicating a high activity of ABC transporters in these cells. The ABCB1 or ABCC1 inhibitor increased significantly fluorescent dye in ARP1 and H1299 over-expressed NEK2, respectively (p < 0.05). Green tinted and red frame histograms showed fluorescence of pre- and post-inhibitor-treated samples, respectively. (D) The clonogenic assay showed that the ABC transporter inhibitor verapamil (5nM) did not inhibit colony formation in both EV and NEK2 OE ARP1 cells. Bortezomib treatment decreased colony efficiency values shown on the figure in the ARP1 EV group, but much less in the NEK2 OE group. The combination of verapamil and bortezomib showed a significant decrease of colony efficiency value in ARP1 NEK2-OE cells (4x). (E) Western blots showed that the AKT inhibitor LY294002 at a dose of 10 μM for 12 hours (Top panel) and β-catenin shRNA (Bottom panel) inhibited the expression of the ABC transporter members ABCB1, ABCC1 and ABCG2 in both EV and NEK2 OE cells, and LY294002 also decreased the nuclear accumulation of β-catenin (Top panel). (F) Inhibition of AKT and Wnt signaling decreased the efflux of the hydrophilic eFluxx-ID gold fluorescent dye showing increased significantly fluorescent dye in ARP1-NEK2 OE cells treated with LY294002 or β-catenin shRNA (p < 0.05). The multi-drug resistance activity factor (MAF) is shown in the figure. (G) The clonogenic assay showed that both LY294002 and β-catenin shRNA treatments inhibited significantly colony formation in both EV and NEK2 OE cells (p < 0.01), especially in the latter (4x). The same membrane was reprobed for the internal control of β–actin or histone H2B for western blot in the Figure 6A, 6B and 6E. Please also see Figure S4 and Table S2.
Figure 7
Figure 7. The model of our working hypothesis
Both PP1/AKT and Wnt pathways are involved in NEK2 inducing cancer cell drug resistance, proliferation and chromosomal instability.

References

    1. Avet-Loiseau H, Facon T, Grosbois B, Magrangeas F, Rapp MJ, Harousseau JL, Minvielle S, Bataille R. Oncogenesis of multiple myeloma: 14q32 and 13q chromosomal abnormalities are not randomly distributed, but correlate with natural history, immunological features, and clinical presentation. Blood. 2002;99:2185–2191. - PubMed
    1. Bahmanyar S, Kaplan DD, Deluca JG, Giddings TH, Jr, O’Toole ET, Winey M, Salmon ED, Casey PJ, Nelson WJ, Barth AI. beta-Catenin is a Nek2 substrate involved in centrosome separation. Genes Dev. 2008;22:91–105. - PMC - PubMed
    1. Barlogie B, Tricot G, Anaissie E, Shaughnessy J, Rasmussen E, van Rhee F, Fassas A, Zangari M, Hollmig K, Pineda-Roman M, et al. Thalidomide and hematopoietic-cell transplantation for multiple myeloma. N Engl J Med. 2006;354:1021–1030. - PubMed
    1. Bergsagel PL, Kuehl WM, Zhan F, Sawyer J, Barlogie B, Shaughnessy J. Cyclin D dysregulation: an early and unifying pathogenic event in multiple myeloma. Blood. 2005;106:296. - PMC - PubMed
    1. Bienz M. The subcellular destinations of APC proteins. Nature Reviews Molecular Cell Biology. 2002;3:328–338. - PubMed

Publication types

MeSH terms

Associated data