. 2013 Mar 15;73(6):1958-68.
doi: 10.1158/0008-5472.CAN-12-3858. Epub 2013 Jan 17.

Phenotypic profiling of DPYD variations relevant to 5-fluorouracil sensitivity using real-time cellular analysis and in vitro measurement of enzyme activity

Affiliations

Phenotypic profiling of DPYD variations relevant to 5-fluorouracil sensitivity using real-time cellular analysis and in vitro measurement of enzyme activity

Steven M Offer et al. Cancer Res. .

Abstract

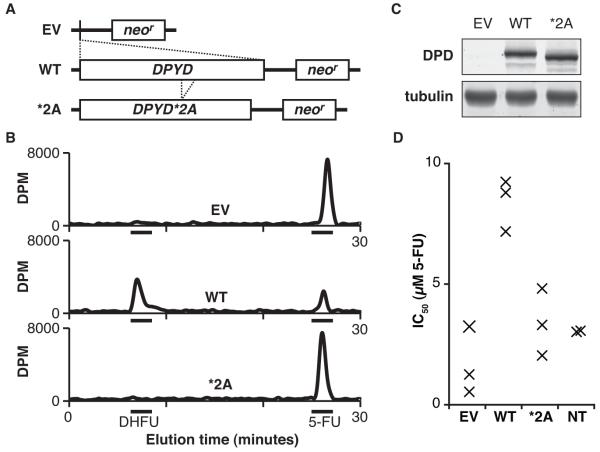
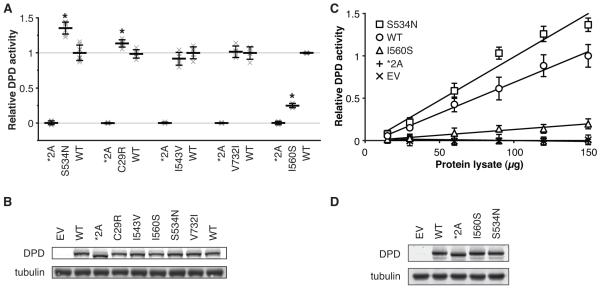
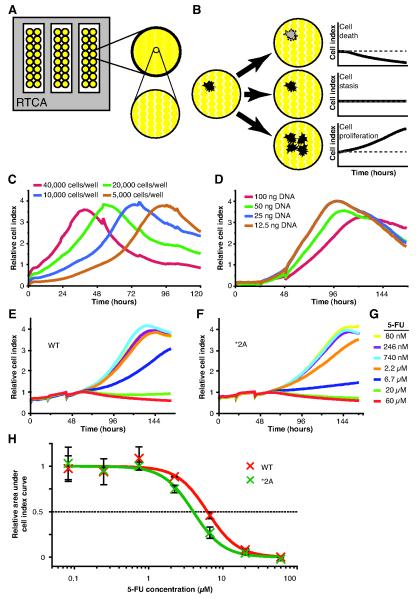
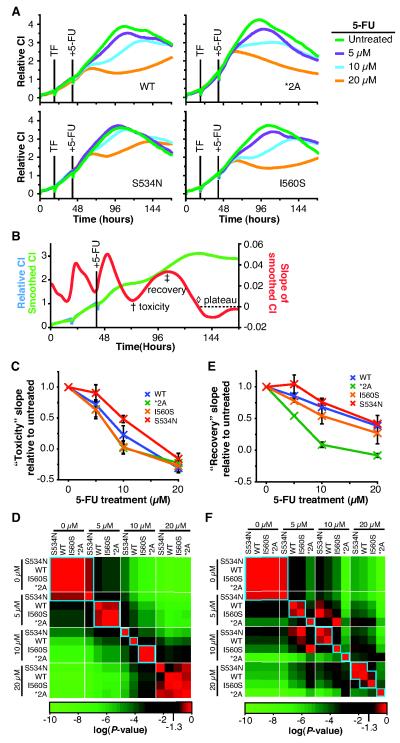
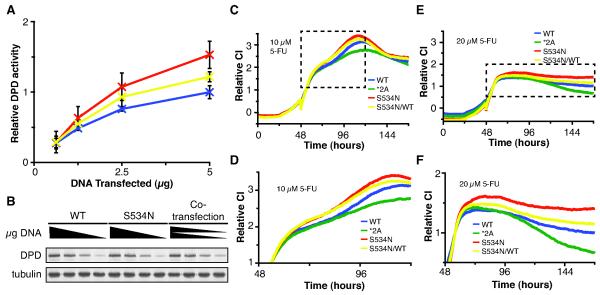
In the 45 years since its development, the pyrimidine analog 5-fluorouracil (5-FU) has become an integral component of many cancer treatments, most notably for the management of colorectal cancer. An appreciable fraction of patients who receive 5-FU suffer severe adverse toxicities, which in extreme cases may result in death. Dihydropyrimidine dehydrogenase (DPD, encoded by DPYD) rapidly degrades 85% of administered 5-FU, and as such, limits the amount of drug available for conversion into active metabolites. Clinical studies have suggested that genetic variations in DPYD increase the risk for 5-FU toxicity, however, there is not a clear consensus about which variations are relevant predictors. In the present study, DPYD variants were expressed in mammalian cells, and the enzymatic activity of expressed protein was determined relative to wild-type (WT). Relative sensitivity to 5-FU for cells expressing DPYD variations was also measured. The DPYD*2A variant (exon 14 deletion caused by IVS14+1G>A) was confirmed to be catalytically inactive. Compared with WT, two variants, S534N and C29R, showed significantly higher enzymatic activity. Cells expressing S534N were more resistant to 5-FU-mediated toxicity compared with cells expressing WT DPYD. These findings support the hypothesis that selected DPYD alleles are protective against severe 5-FU toxicity, and, as a consequence, may decrease the effectiveness of 5-FU an antitumor drug in carriers. In addition, this study shows a method that may be useful for phenotyping other genetic variations in pharmacologically relevant pathways.


Figures

Figure 1
Figure 1. Measurement of DPD enzyme activity in cells transfected with DPYD expression constructs
A, the human DPYD gene (WT) and the *2A variant lacking sequence corresponding to exon 14 (*2A) were engineered into the pIRES-neo3 expression vector (EV corresponds to the empty parental vector). B, lysates prepared from transfected cells were assayed for DPD-dependent conversion of radiolabeled 5-FU to DHFU as measured by HPLC (DPM, disintegrations per minute). C, DPD expression levels were measured by immunoblot of DPD and alpha-tubulin. D, the concentration of 5-FU that inhibits cell growth by 50% (IC50) was determined by treating transfected and non-transfected (NT) cells with a dilution series of 5-FU and measuring cell viability 48 hours after 5-FU treatment. Each individual data point (represented by an “x”) constitutes the IC50 calculated as the mean of three technical replicates.
Figure 2
Figure 2. Screening of five additional single amino acid DPD variants for enzyme activity
A, cell lysates from cells transfected with vectors encoding the DPD amino acid variants S534N, C29R, I543V, V732I, and I560S were assayed for DPD enzyme activity in parallel with negative (*2A) and positive (WT) controls. Horizontal bars represent the mean of replicate experiments +/− the standard deviation of normalized results. To show the overall variance of data, individual replicate data points are represented by an “x.” Variants that show a significant increase or decrease in DPD enzyme function compared to WT are denoted by an “*”. B, equivalent expression of DPD variants was confirmed by immunoblot against DPD and alpha-tubulin. A representative blot is depicted. C, empty vector (EV), WT, *2A, I560S, and S534N were transfected in parallel and DPD enzyme activity determined using varying quantities of protein lysates. Data was normalized and scaled to the results for the mean of 150 μg *2A and 150 μg WT. Error bars represent the standard deviation of 5 independent biological replicates. D, representative immunoblot depicting equivalent expression of DPD variants used for panel c.
Figure 3
Figure 3. Real-time cellular analysis of variant-expressing cells treated with 5-FU
A, the surface area of RTCA plates are ~80% covered with gold microelectrodes used for measuring impedance. B, cells attached to the plate surface disrupt conductivity at the electrode-solution interface enabling the kinetic monitoring of changes in the cell population. C, HEK293T/c17 cells were seeded at varying densities and CI monitored. D, cells were transfected with varying amounts of plasmid DNA (empty pIRES-neo3 vector) using a 3:1 ratio of FuGene HD to plasmid. Cells were cultured on RTCA plates for 20 hours and transfected with vectors encoding wt DPYD (WT, E) and the catalytically inactive *2A variant (F). 20 hours after transfection, cells were treated with the concentrations of 5-FU indicated (G). H, area under the curve was determined for each CI profile using an analysis window defined as 8 hours to 96 hours after 5-FU treatment and the mean inhibitory concentration (IC50) of 5-FU was calculated. Data was rescaled relative to the maximum and minimum asymptotes for ease of visualization and is presented +/− the standard deviation of 3 technical replicates. Cell index profiles in C-F represent the average of 3 technical replicates. Data in E and F was normalized to 8 hours post 5-FU treatment using the delta method.
Figure 4
Figure 4. Classification of functional variants using RTCA to measure relative sensitivity to 5-FU
A, HEK293T/c17 cells were plated on RTCA plates, cultured for 20 hours, and transfected with expression plasmids encoding wt DPYD (WT), *2A, S534N, or I560S. After 20 hours, media was replaced and cells were treated with the indicated concentrations of 5-FU. Experiments were conducted as three independent biological replicates, each consisting of three technical replicates. A representative biological replicate is presented in A. B, to objectively analyze the kinetic data produced, profiles were smoothed and the CI slope was determined for each data point collected. The relative minimum and maximum CI slopes, following the initial increase due to changing of the culture media, were determined as detailed in Supplementary Figure S3 and were termed the “toxicity” (†) and “recovery” (‡) timepoints, respectively. C, a summary of CI slopes at the toxicity time point is presented normalized to the untreated data for a given variant. Error bars represent the standard deviation of 3 biological replicates. D, P values comparing differences between individual samples were determined using the least squares means differences Student’s t-test and are presented as a heat map. E, the recovery slope was compared for different treatments. Data were normalized and results are presented in the same manner as for panel C. F, a heat map of P values determined for (E) is presented.
Figure 5
Figure 5. Co-transfection studies to evaluate variants present as heterozygous alleles
A, the indicated quantities of expression plasmids for wt and S534N were transfected into HEK293T/c17 cells and DPD enzyme activity determined for lysates. For co-transfections (S534N/WT), equal quantities of wt and S534N expression plasmids were mixed, and the indicated amount of total plasmid was transfected. Error bars indicate standard deviation of three independent biological replicates. B, expression of DPD and alpha-tubulin was determined. A representative immunoblot is presented. C-F, HEK293T/c17 cells were seeded onto RTCA plates and cultured for 24 hours, at which time they were transfected with the indicated expression plasmids or mixture of plasmids (S534N/WT). After an additional 24 hours, cells were treated with 10 μM (C) or 20 μM (E) 5-FU. The boxed regions in C and E correspond to the enlarged areas presented in D and F, respectively. CI data represents the average values for three technical replicates performed in parallel and normalized to 6 hours after 5-FU treatment using the delta method.

Similar articles

Cited by

References

    1. Rich TA, Shepard RC, Mosley ST. Four decades of continuing innovation with fluorouracil: current and future approaches to fluorouracil chemoradiation therapy. Journal of clinical oncology: official journal of the American Society of Clinical Oncology. 2004;22:2214–32. - PubMed
    1. MacMillan WE, Wolberg WH, Welling PG. Pharmacokinetics of fluorouracil in humans. Cancer Res. 1978;38:3479–82. - PubMed
    1. Heggie GD, Sommadossi JP, Cross DS, Huster WJ, Diasio RB. Clinical pharmacokinetics of 5-fluorouracil and its metabolites in plasma, urine, and bile. Cancer Res. 1987;47:2203–6. - PubMed
    1. Longley DB, Harkin DP, Johnston PG. 5-fluorouracil: mechanisms of action and clinical strategies. Nat Rev Cancer. 2003;3:330–8. - PubMed
    1. Harris BE, Song R, Soong SJ, Diasio RB. Relationship between dihydropyrimidine dehydrogenase activity and plasma 5-fluorouracil levels with evidence for circadian variation of enzyme activity and plasma drug levels in cancer patients receiving 5-fluorouracil by protracted continuous infusion. Cancer Res. 1990;50:197–201. - PubMed

Publication types

MeSH terms

Substances