. 2013 Jan 17;4(1):e461.
doi: 10.1038/cddis.2012.213.

Computational classification of mitochondrial shapes reflects stress and redox state

Affiliations

Computational classification of mitochondrial shapes reflects stress and redox state

T Ahmad et al. Cell Death Dis. .

Abstract

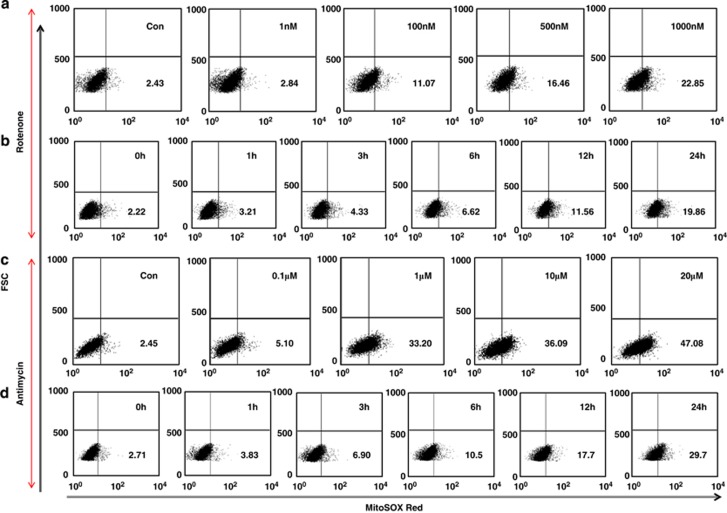
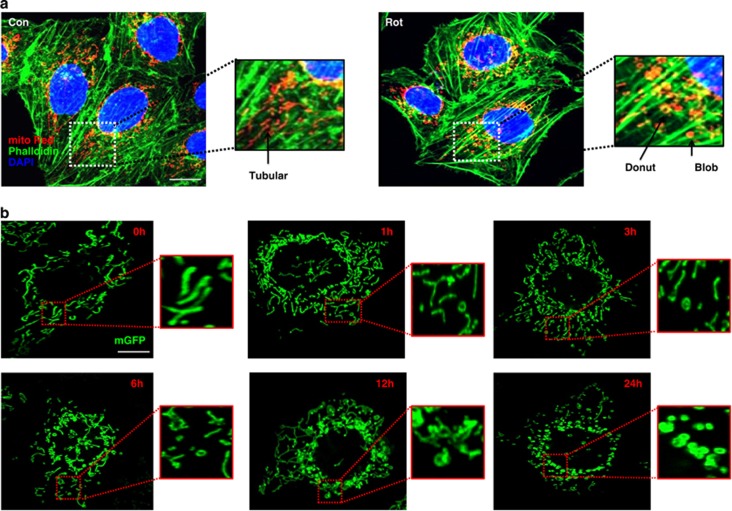
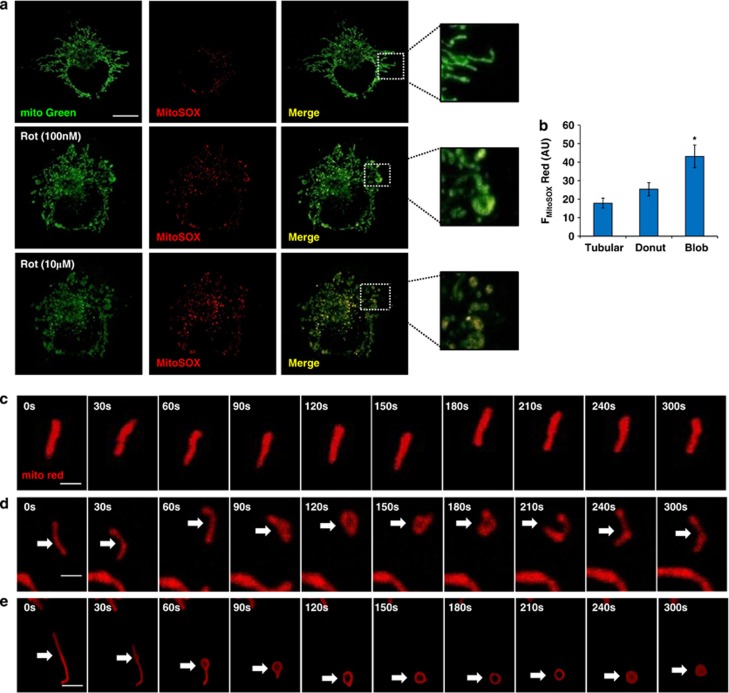
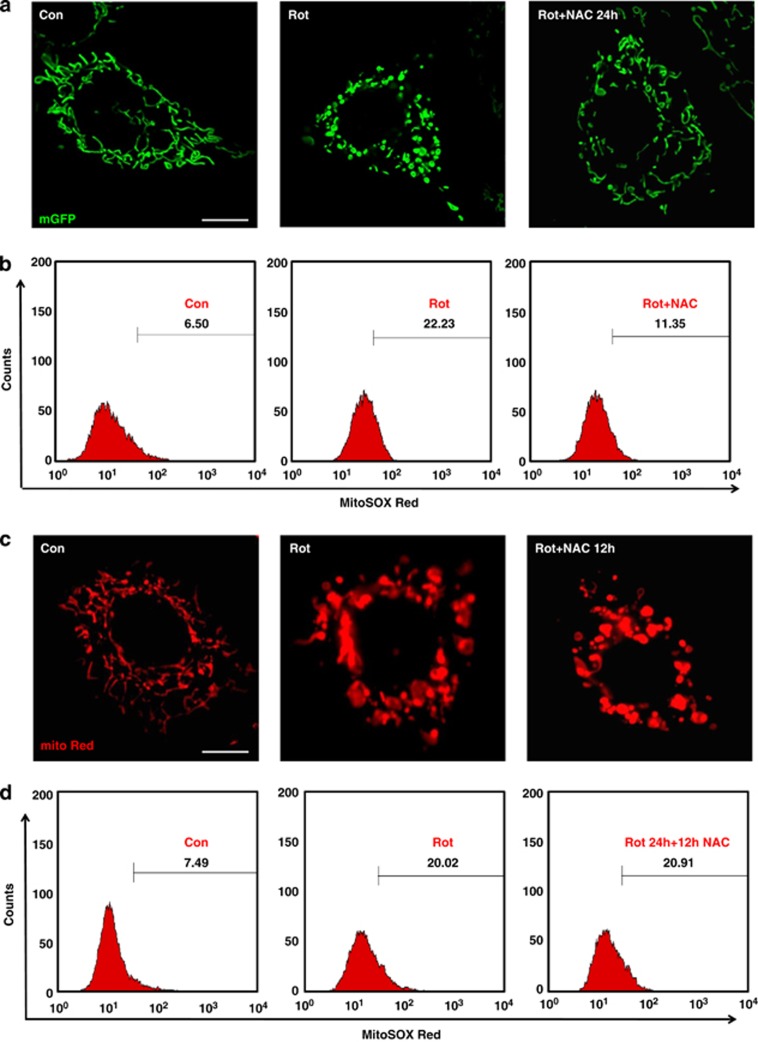
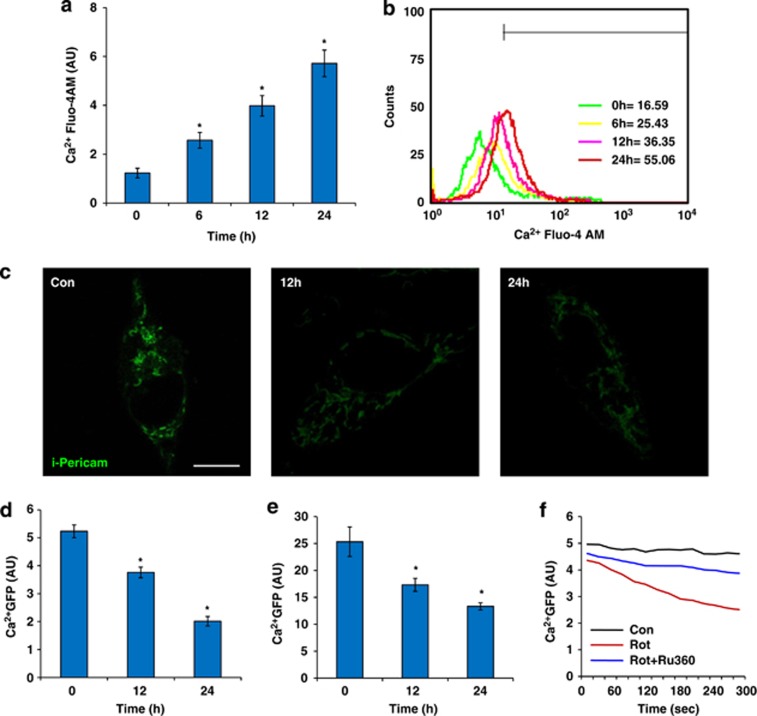
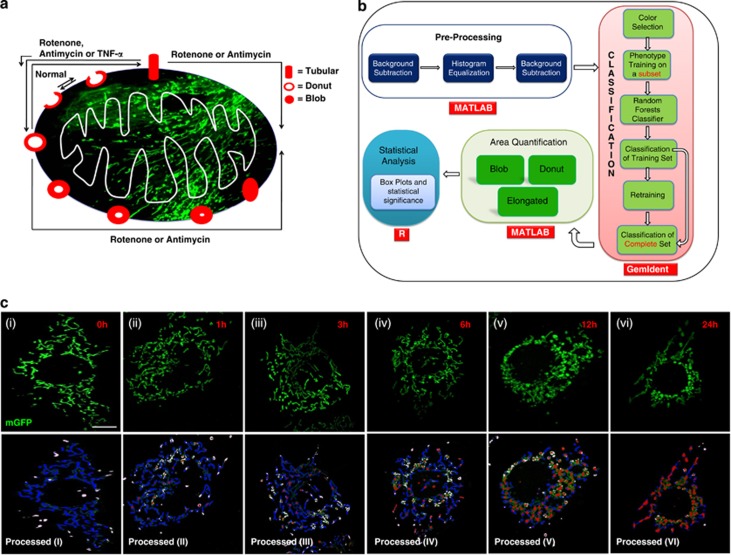
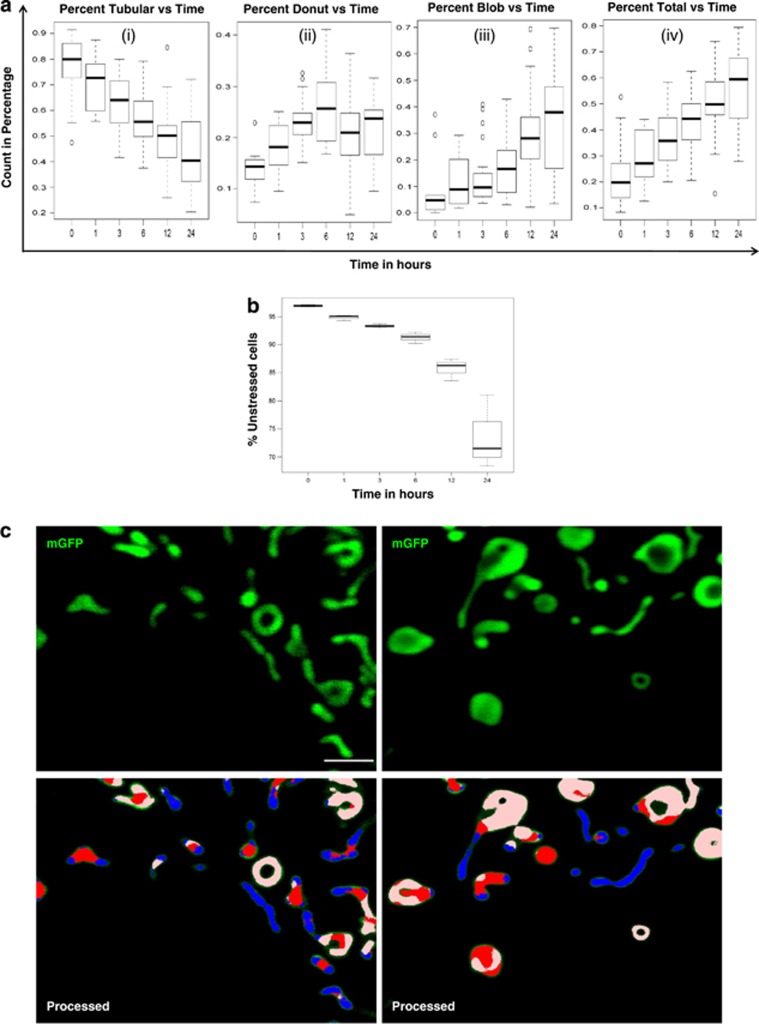
Dynamic variations in mitochondrial shape have been related to function. However, tools to automatically classify and enumerate mitochondrial shapes are lacking, as are systematic studies exploring the relationship of such shapes to mitochondrial stress. Here we show that during increased generation of mitochondrial reactive oxygen species (mtROS), mitochondria change their shape from tubular to donut or blob forms, which can be computationally quantified. Imaging of cells treated with rotenone or antimycin, showed time and dose-dependent conversion of tubular forms to donut-shaped mitochondria followed by appearance of blob forms. Time-lapse images showed reversible transitions from tubular to donut shapes and unidirectional transitions between donut and blob shapes. Blobs were the predominant sources of mtROS and appeared to be related to mitochondrial-calcium influx. Mitochondrial shape change could be prevented by either pretreatment with antioxidants like N-acetyl cysteine or inhibition of the mitochondrial calcium uniporter. This work represents a novel approach towards relating mitochondrial shape to function, through integration of cellular markers and a novel shape classification algorithm.


Figures

Figure 1
Figure 1
Increased mitochondrial ROS generation with mitochondrial inhibitors. ROS measurement in BEAS-2B cells with different concentrations of rotenone as indicated (a). All measurements were at 12 h post rotenone. (b) Time dependent increase in ROS generation by mitochondria, by inducing cells with a sublethal rotenone concentration (100 nℳ). Similar Results were obtained with antimycin, which was used at different concentrations as indicated on box plots (c) and a suboptimal concentration (0.1 μℳ) was used for time kinetic experiments (d). MitoSOX Red fluorescence is shown on X-axis, and cell size on Y-axis (FSC)
Figure 2
Figure 2
Mitochondrial shape change with Stress. (a) Tubular mitochondrial shapes are seen in control (Con) cells, with other shapes (Donut/Blob) emerging after rotenone (Rot) treatment. A magnified portion of control or rotenone treated cell showing all the three shapes (a). (b) Time-dependent change in mitochondrial shape after rotenone treatment, with time points as indicated on figures, magnified portions of the images show a clear shape change in mitochondria with time. BEAS-2B cells were transfected with mGFP and imaged at the indicated time points. Scale bars; 10 μm
Figure 3
Figure 3
Blob shaped mitochondria has increased mtROS and is an irreversible form. Blob/Donut from was associated with increased mtROS generation as revealed by live cell imaging (a). Images are shown for each color and merged for control and rotenone (100 nℳ for 12 h) pretreated cells at 0 s and 300 s after induction with further 10 μℳ of rotenone. Yellow color denotes mitochondria that are actively producing mtROS. (b) Spatial differences in mtROS quantified for different shapes of mitochondria and represented as total flourescent intensity of MitoSOX Red (FMitoSOX Red) in arbitrary units (AU). Blob shaped mitochondria were the predominant source of mtROS (b). Time lapse images of a single mitochondrion under control (c, d) and rotenone treated conditions (e), with shape change from Tubular to Blob via Donut form (e). Mitochondria are labeled with Mitotracker Green (mito Green) and mtROS (MitoSOX Red, red) (a) and with mitotracker red (c–e). Data is the representative of three different experiments with at least 10 images used for quantitation. Scale bars; 10 μm (a) and 5 μm (c–e). *denotes P<0.05 versus Tubular form
Figure 4
Figure 4
Mitochondrial shape change is reversible and mediated by increased mitochondrial calcium uptake. Pretreatment of rotenone induced BEAS-2B cells with NAC prevented the formation of donut or blob-shaped mitochondria with more pronounced effect on blob shape (a). Cells were transfected with mGFP and imaged after 24 h of time under control (Con), rotenone treated (Rot) and Rotenone treated with NAC pretreatment conditions (Rot+NAC 24 h). NAC treatment was given 1 h before rotenone induction. NAC treatment was also associated with decreased mtROS production (b). (c) NAC treatment after 12 h of rotenone induction did not prevent the formation of donut/blob shaped mitochondria. Cells were labeled with mitotracker red (mito Red) to see the mitochondrial shape changes. (d) ROS measurement did not show any decrease in mtROS levels with NAC treatment after 12 h of rotenone treatment as revealed by FACS data for the mtROS. Scale bars; 10 μm
Figure 5
Figure 5
Calcium-dependent changes in mitochondrial shape. Calcium was measured in rotenone induced BEAS-2B cells with calcium sensitive dye (Fluo-4AM) at various time points, with mean cellular intensity, as quantified from the confocal images (a) and fluorescence quantitation using flow cytometry (b). Mitochondrial calcium imaging as done by i-pericam (green), in control and rotenone induced conditions (c), with mean GFP calcium intensity (d). (e) FACS based measurement of mean calcium intensity at different time points with rotenone treatment. (f) Ruthenium-360 (Ru360), a mitochondrial calcium uniporter inhibitor, inhibits mitochondrial calcium entry, measured by FACS over 300 s after 10 μM rotenone. Scale bars; 25 μm. *denotes P<0.05 versus 0 hour (h) time point
Figure 6
Figure 6
Shape recognition pipeline for automated classification of different mitochondrial shapes. Graphical representation of mitochondrial shape change during stresses (a). A schematic overview of the pipeline (b). Recognition of different shapes of mitochondria by the software (c) at different time points as indicated on figures. Mitochondria were labeled with mGFP (true color) and the software processed images were pseudo colored as, blue=Tubular, white=Donut, red=Blob and green=not classifiable. Mitochondria were in Tubular form under normal conditions (cI,) with a time-dependent trend towards blob or donut form under stress conditions (cII to cVI). More than 15 images were used for quantitation. Scale bars; 10 μm
Figure 7
Figure 7
High-throughput automated mitochondrial shape quantification. Mitochondrial shape quantification done by the software shows the correlation of different shapes of mitochondria with time after rotenone treatment. (a) Percentage of mitochondria classified as belong to a particular shape, as a function of time after rotenone treatment. Tubular forms diminish with time, with donut shapes rising within 1 h and blobs increasing at late time (6 h onwards). Total refers to the sum of donut and blobs. The increase in blob mitochondrial shapes (a) inversely match the fraction of un-stressed cells (cells with low mtROS levels determined by FACS) (b). (c) High resolution confocal images to clearly visualize all three forms of mitochondria. Software could reliably distinguish between all the three forms of mitochondria, blue=Tubular, white=Donut, red=Blob and green=not detected. At least 15 images were used for quantitation. Scale bars; 5 μm

References

    1. Youle RJ, van der Bliek AM. Mitochondrial fission, fusion, and stress. Science. 2012;337:1062–1065. - PMC - PubMed
    1. Chan DC. Mitochondria: dynamic organelles in disease, aging, and development. Cell. 2006;125:1241–1252. - PubMed
    1. Shaw JM, Nunnari J. Mitochondrial dynamics and division in budding yeast. Trends Cell Biol. 2002;12:178–184. - PMC - PubMed
    1. Gomes LC, Di BG, Scorrano L. During autophagy mitochondria elongate, are spared from degradation and sustain cell viability. Nat Cell Biol. 2011;13:589–598. - PMC - PubMed
    1. Shutt TE, McBride HM. Staying cool in difficult times: Mitochondrial dynamics, quality control and the stress response. Biochim Biophys Acta. 2012. - PubMed

Publication types