. 2013 Jan 17;4(1):e467.
doi: 10.1038/cddis.2012.205.

Drosophila Trap1 protects against mitochondrial dysfunction in a PINK1/parkin model of Parkinson's disease

Affiliations

Drosophila Trap1 protects against mitochondrial dysfunction in a PINK1/parkin model of Parkinson's disease

A C Costa et al. Cell Death Dis. .

Abstract

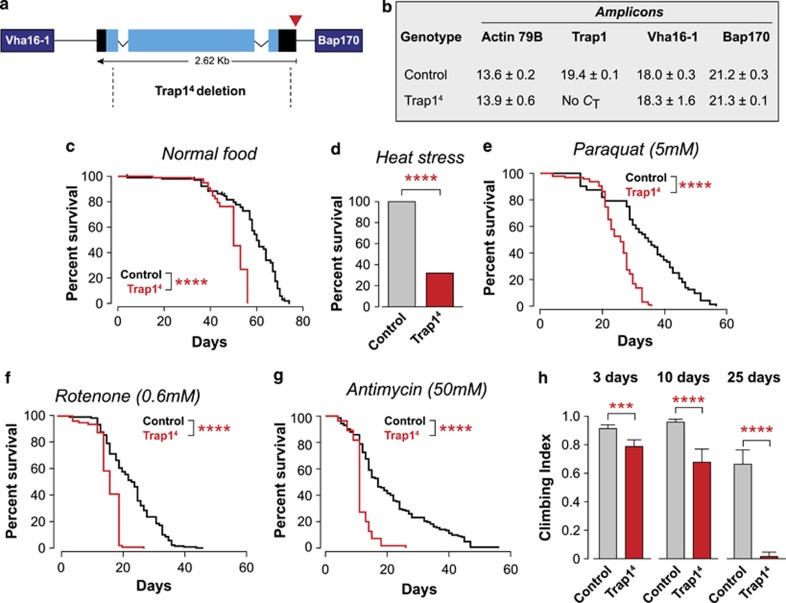
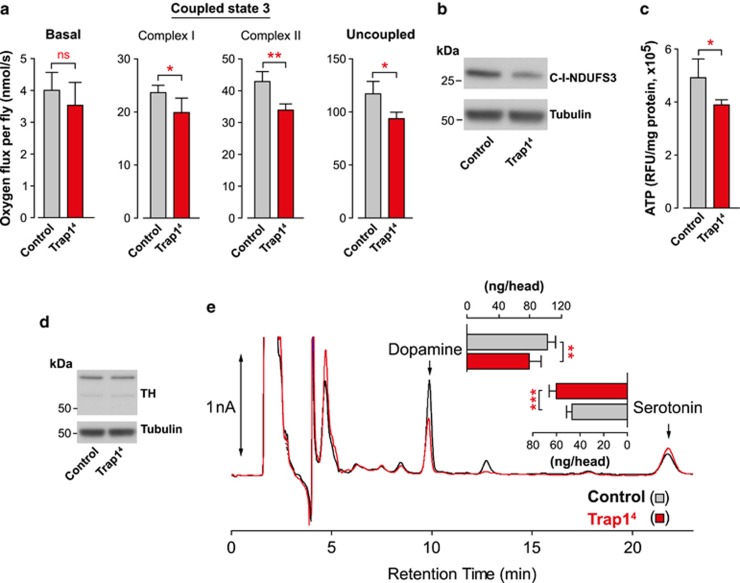
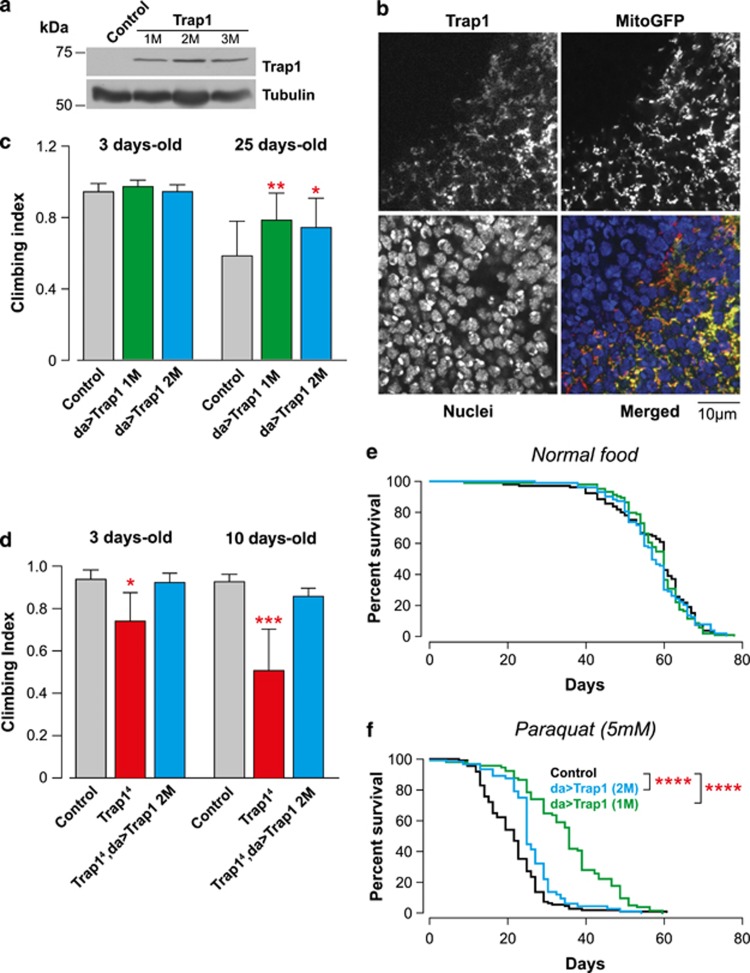
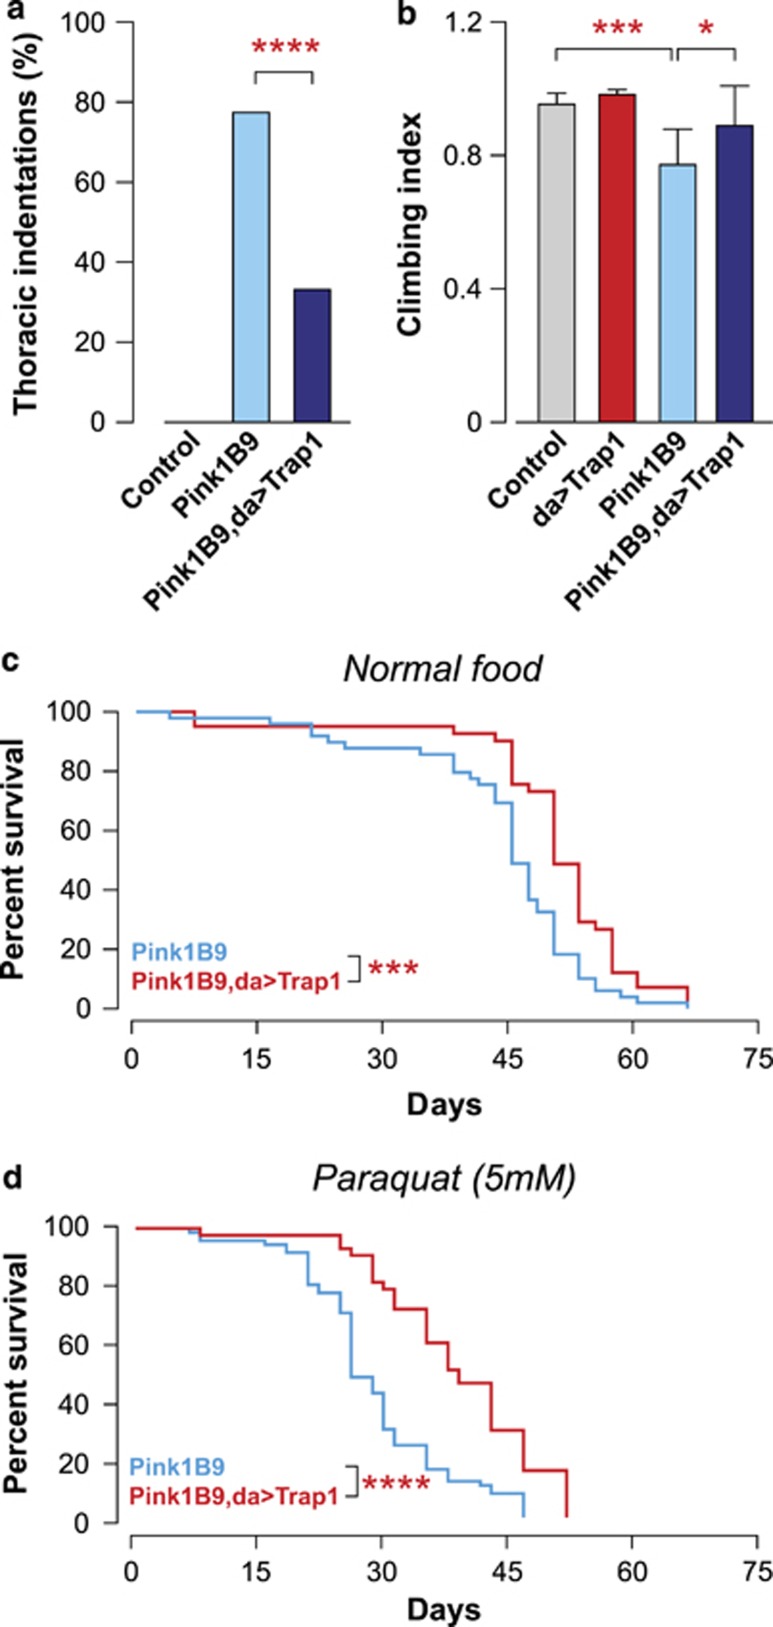
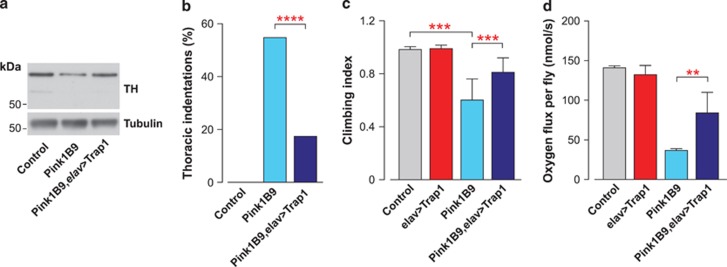
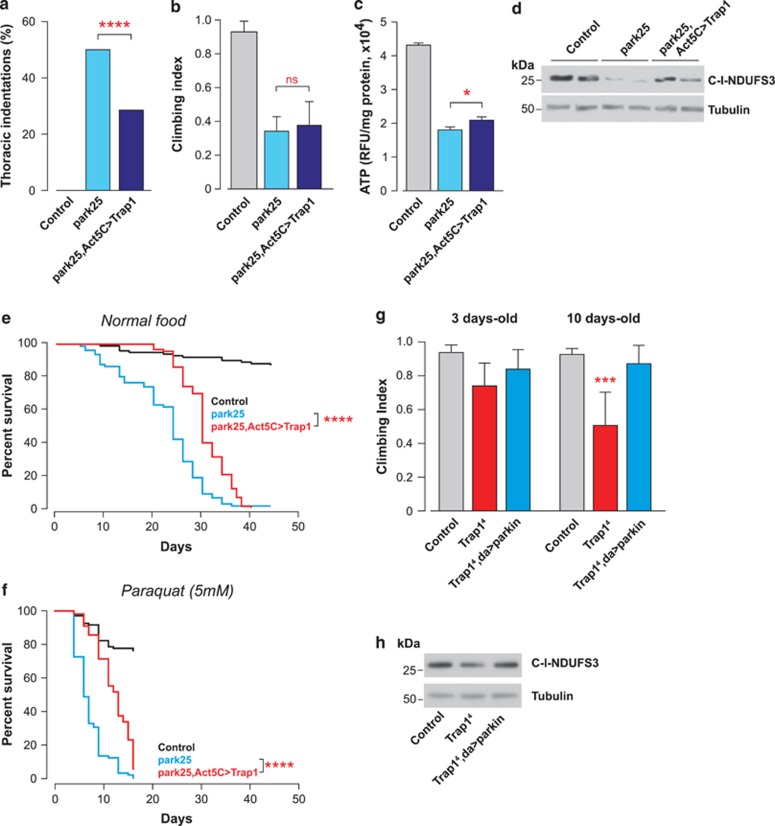
Mitochondrial dysfunction caused by protein aggregation has been shown to have an important role in neurological diseases, such as Parkinson's disease (PD). Mitochondria have evolved at least two levels of defence mechanisms that ensure their integrity and the viability of their host cell. First, molecular quality control, through the upregulation of mitochondrial chaperones and proteases, guarantees the clearance of damaged proteins. Second, organellar quality control ensures the clearance of defective mitochondria through their selective autophagy. Studies in Drosophila have highlighted mitochondrial dysfunction linked with the loss of the PTEN-induced putative kinase 1 (PINK1) as a mechanism of PD pathogenesis. The mitochondrial chaperone TNF receptor-associated protein 1 (TRAP1) was recently reported to be a cellular substrate for the PINK1 kinase. Here, we characterise Drosophila Trap1 null mutants and describe the genetic analysis of Trap1 function with Pink1 and parkin. We show that loss of Trap1 results in a decrease in mitochondrial function and increased sensitivity to stress, and that its upregulation in neurons of Pink1 mutant rescues mitochondrial impairment. Additionally, the expression of Trap1 was able to partially rescue mitochondrial impairment in parkin mutant flies; and conversely, expression of parkin rescued mitochondrial impairment in Trap1 mutants. We conclude that Trap1 works downstream of Pink1 and in parallel with parkin in Drosophila, and that enhancing its function may ameliorate mitochondrial dysfunction and rescue neurodegeneration in PD.


Figures

Figure 1
Figure 1
The loss of Trap1 in Drosophila causes motor impairment and an increased sensitivity to stress. (a) Genomic map of Trap1 (cytological location 42B2). Black, untranslated regions; light blue, exons. The P-element insertion (EY10238) is indicated by the red triangle. The neighbouring genes (Vha16-1 and Bap170) are indicated in dark blue. Trap14 deletion, delimited by the dashed lines, removes most of the Trap1 gene. (b) Analysis of the expression levels of Trap1 and its neighbouring genes. Expression levels were measured by real-time PCR in 3-day-old flies with the indicated genotypes (mean Ct±S.D., n=4 per genotype). Expression of actin was used as a control. No Ct for the Trap1 transcript was detected in Trap14 mutants. (c) Trap14 mutants (red) have a reduced lifespan compared with the controls (black). Fly viability was scored over a period of 75 days, using a minimum of 100 flies per genotype. The statistical significance is indicated (log-rank, Mantel–Cox test). (dg) Trap1 mutant flies show enhanced sensitivity to stress. (d) Flies were subjected to heat stress, and viability was assessed after 24 h. A total of 100 males (4 days old) were assayed for each genotype. The asterisks indicate significant values (Fisher's exact test, two-sided, alpha<0.05). (eg) Flies were maintained on food supplemented with the indicated drugs, and the viability was scored over a period of 60 days, using a minimum of 100 flies per genotype. The statistical significance is indicated by the asterisks (log-rank, Mantel–Cox test). (h) Trap14 mutants show a decrease in motor performance. Flies with the indicated genotypes and ages were tested using a standard climbing assay (mean±S.D., n≥80 flies for each genotype). The asterisks indicate significant values (two-way ANOVA with the Bonferroni multiple comparison test)
Figure 2
Figure 2
The loss of Trap1 in Drosophila results in a reduction of mitochondrial function and brain dopamine levels. (a) Decreased respiration in Trap14 mutant flies. Activity was measured by high-resolution respirometry in 20-day-old flies. Data are shown as the means±S.D. (n≥4 in each genotype). Significant values relative to the control are indicated by asterisks (two-tailed unpaired t test). (b) Decreased complex I protein levels in Trap14 mutant flies. Whole-fly (20 days old) protein lysates were subjected to western blot analysis with the indicated antibodies. (c) Trap14 mutants have lower levels of ATP compared with the controls. The ATP levels were measured using a bioluminescent assay. Data are shown as the means±S.D. (n=4 for each genotype). The statistical significance is indicated by asterisks (two-tailed unpaired t-test). (d) Analysis of TH levels in Trap1 mutant flies. Fly-head protein lysates from 20-day-old flies were used for western blotting analysis with the indicated antibodies. (e) Trap1 mutant flies have decreased dopamine and increased serotonin levels. Neurotransmitter levels were assessed by HPLC with electrochemical detection. Data are shown as the means±S.D. (n≥5 for each genotype). The statistical significance is indicated by asterisks (two-tailed unpaired t-test)
Figure 3
Figure 3
Expression of Drosophila Trap1 confers resistance to stress. (a) Analysis of the Trap1 expression levels in transgenic flies. Whole-fly lysates were analysed by western blotting with the indicated antibodies. (b) Trap1 localises to the mitochondria. Confocal analysis of the posterior compartment of larval wing discs coexpressing Trap1 and a mitoGFP under the control of the enGAL4 driver. In the merged colour image, red corresponds to Trap1, blue to nuclei and green to mitoGFP. (c) The expression of Trap1 results in increased motor performance. Flies with the indicated genotypes and ages were tested using a standard climbing assay (mean±S.D., n≥120 flies for each genotype). The asterisks indicate significant values relative to the control (two-way ANOVA with the Bonferroni multiple comparison test). (d) The expression of Trap1 reversed the decrease in motor performance in Trap14 mutants. Flies with the indicated genotypes and ages were tested using a standard climbing assay (mean±S.D., n≥80 flies for each genotype). The asterisks indicate significant values relative to the control (two-way ANOVA with the Bonferroni multiple comparison test). (e) Trap1 expression does not affect the total lifespan. A total of 100 flies per genotype were maintained on normal food for a period of 80 days. (f) Trap1-expressing flies (green and blue) show enhanced resistance to paraquat toxicity compared with the controls (black). Fly viability was scored over a period of 60 days using a minimum of 100 flies per genotype. The statistical significance is indicated by the asterisks (log-rank, Mantel–Cox test)
Figure 4
Figure 4
Trap1 gain-of-function rescues Pink1 mutant flies. (a) Expression of Trap1 rescues the thoracic defects of Pink1B9 mutants. Thoracic indentations were counted up to 24 h after eclosion (n>900 for each genotype). The asterisks indicate significance (χ2, two-sided, alpha<0.05). (b) Trap1 expression suppresses motor impairment in the Pink1B9 mutants. 10-day-old flies with the indicated genotypes were tested using a standard climbing assay (mean±S.D., n=120 flies per genotype). The statistical significance relative to Pink1B9 is indicated by asterisks (one-way ANOVA with Dunnett's multiple comparison test). (c and d) Trap1 expression enhances the lifespan of Pink1B9 mutants. A minimum of 80 flies per genotype were maintained on either normal (c) or paraquat-containing food (d). Fly viability was scored over a period of 70 days. The statistical significance is indicated by the asterisks (log-rank, Mantel–Cox test)
Figure 5
Figure 5
Drosophila Trap1 reverses mitochondrial dysfunction in Pink1 mutants. (a) Trap1 expression restores the mitochondrial complex I protein levels in the Pink1B9 mutant flies. Whole-fly protein lysates were used for western blotting analysis with the indicated antibodies. (b) Trap1 expression partially rescues the mitochondrial respiratory defects in the Pink1B9 mutants. Measurements of state three respiration of complex I and complex II, and complex II uncoupled respiration by high-resolution respirometry. The data are shown as the means±S.D. (n=6 for each genotype). The statistical significance is indicated by the asterisks (one-way ANOVA with Dunnett's multiple comparison test). (c) Expression of Trap1 increased the ATP levels in the Pink1B9 mutants. ATP levels were measured using a bioluminescent assay. Data are shown as the means±S.D. (n=4 for each genotype). The statistical significance is indicated by the asterisks (one-way ANOVA with Dunnett's multiple comparison test relative to the control)
Figure 6
Figure 6
Targeted neuronal expression of Trap1 rescues mitochondrial dysfunction in Pink1 mutants. (a) Decreased TH levels observed in the Pink1B9 mutants can be partially restored by the expression of Trap1 in neurons. Fly-head protein lysates from 20-day-old flies were used for western blotting analysis with the indicated antibodies. (b) Neuronal expression of Trap1 is capable of diminishing the degree of thoracic indentations in the Pink1B9 mutants. Thoracic indentations were counted up to 24 h after eclosion (n>300 for each genotype). The asterisks indicate the significance relative to Pink1B9 (χ2, two-sided, alpha<0.05). (c) Targeted neuronal expression of Trap1 improves the climbing performance of Pink1B9 mutants. 10-day-old flies with the indicated genotypes were tested using a standard climbing assay (mean±S.D., n=120 flies per genotype). The statistical significance relative to Pink1B9 is indicated by the asterisks (one-way ANOVA with Dunnett's multiple comparison test). (d) Expression of Trap1 specifically in neurons is sufficient to improve mitochondrial respiration in the Pink1B9 mutants. Complex II-uncoupled respiration was measured by high-resolution respirometry. Data are shown as the means±S.D. (n=6 for each genotype). The statistical significance is indicated by the asterisks (one-way ANOVA with Dunnett's multiple comparison test relative to the Pink1B9 mutant)
Figure 7
Figure 7
Epistatic relationship between Trap1 and parkin. (a) Trap1 expression decreases the degree of thoracic indentations in parkin mutant flies, park25. Thoracic indentations were counted up to 24 h after eclosion (n>250 for each genotype). The asterisks indicate the significance (χ2, two-sided, alpha<0.05). (b) The expression of Trap1 fails to rescue the climbing defect of the park25 mutants. 3-day-old flies with the indicated genotypes were tested using a standard climbing assay (mean±S.D., n>120 flies per genotype). (c) Trap1 expression increases the levels of ATP in the park25 mutants. The ATP levels were measured using a bioluminescent assay. Data are shown as the means±S.D. (n=4 for each genotype). The statistical significance is indicated by the asterisks (one-way ANOVA with Dunnett's multiple comparison test relative to park25). (d) Trap1 expression restores the mitochondrial complex I protein levels in the park25 mutant flies. Whole-fly protein lysates were used for western blotting analysis with the indicated antibodies. (e) Trap1 expression enhances the lifespan of the park25 mutants. Fly viability was scored over a period of 40 days using a minimum of 100 flies per genotype. The statistical significance is indicated by the asterisks (log-rank, Mantel–Cox test). (f) Expression of Trap1 increases the resistance of park25 mutants to paraquat-induced stress. Fly viability was scored over a period of 15 days using a minimum of 80 flies per genotype. The statistical significance is indicated by the asterisks (log-rank, Mantel–Cox test). (g) The expression of parkin rescues the climbing defects of Trap14 mutants. Flies with the indicated genotypes and ages were tested using a standard climbing assay (mean±S.D., n>60 flies per genotype). The asterisks indicate significant values (two-way ANOVA with the Bonferroni multiple comparison test). (h) parkin expression restores the mitochondrial complex I protein levels in Trap14 mutant flies. Whole-fly protein lysates from 20-day-old flies were used for western blotting analysis with the indicated antibodies

References

    1. de Castro IP, Martins LM, Tufi R. Mitochondrial quality control and neurological disease: an emerging connection. Expert Rev Mol Med. 2010;12:e12. - PMC - PubMed
    1. Baker MJ, Tatsuta T, Langer T. Quality control of mitochondrial proteostasis. Cold Spring Harb Perspect Biol. 2011;3:a007559. - PMC - PubMed
    1. Tatsuta T, Langer T. Quality control of mitochondria: protection against neurodegeneration and ageing. EMBO J. 2008;27:306–314. - PMC - PubMed
    1. Haynes CM, Ron D. The mitochondrial UPR - protecting organelle protein homeostasis. J Cell Sci. 2010;123:3849–3855. - PubMed
    1. Twig G, Elorza A, Molina AJ, Mohamed H, Wikstrom JD, Walzer G, et al. Fission and selective fusion govern mitochondrial segregation and elimination by autophagy. Embo J. 2008;27:433–446. - PMC - PubMed

Publication types

MeSH terms