

Global microRNA profiling of well-differentiated small intestinal neuroendocrine tumors
- PMID: 23328977
- PMCID: PMC3647117
- DOI: 10.1038/modpathol.2012.216
Global microRNA profiling of well-differentiated small intestinal neuroendocrine tumors
Abstract
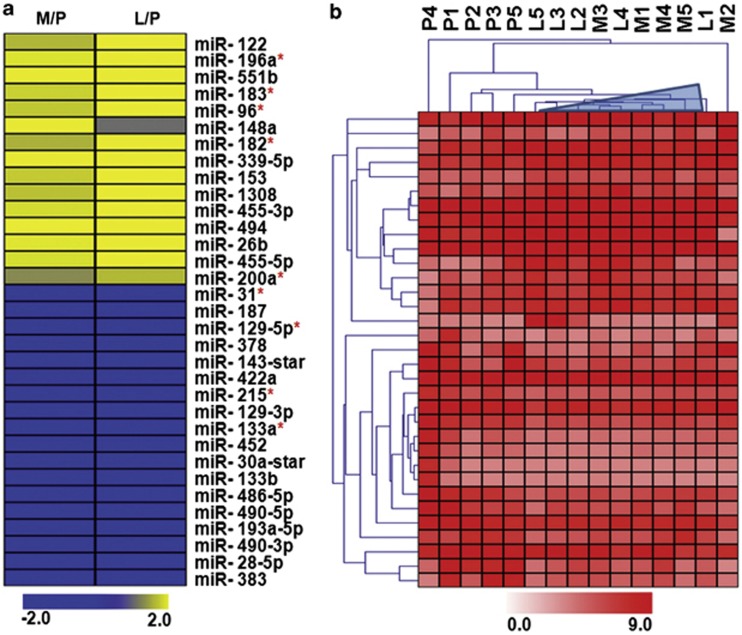
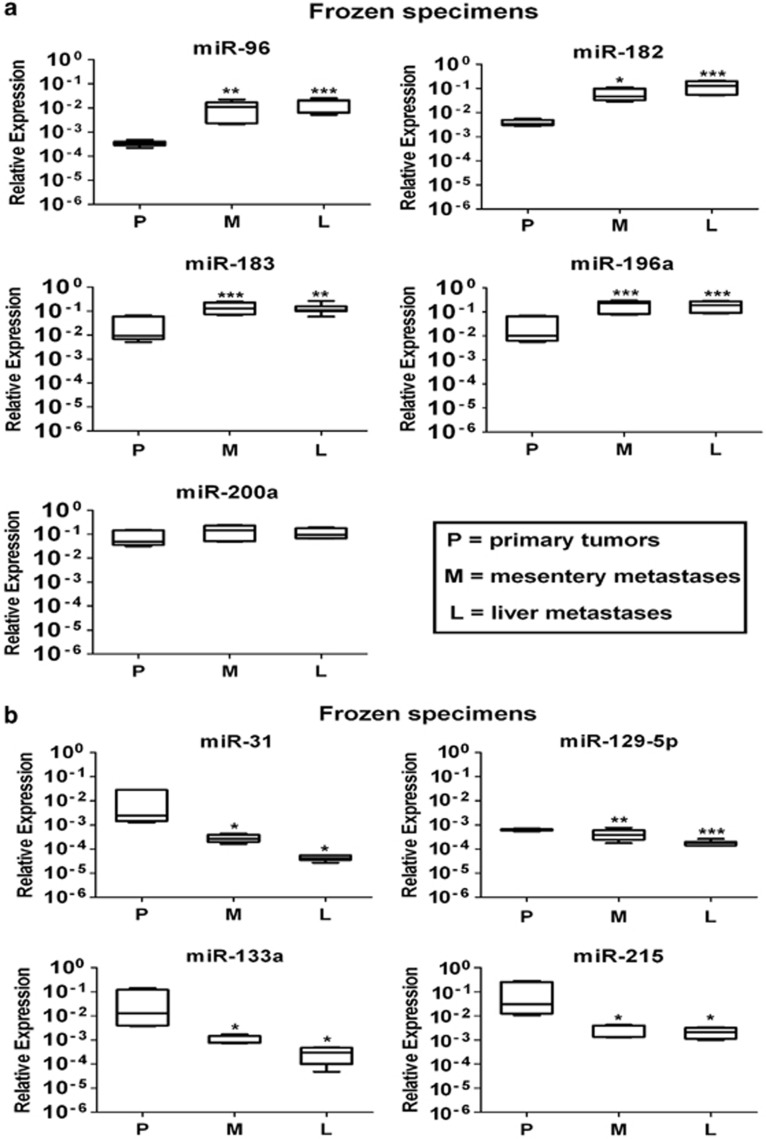
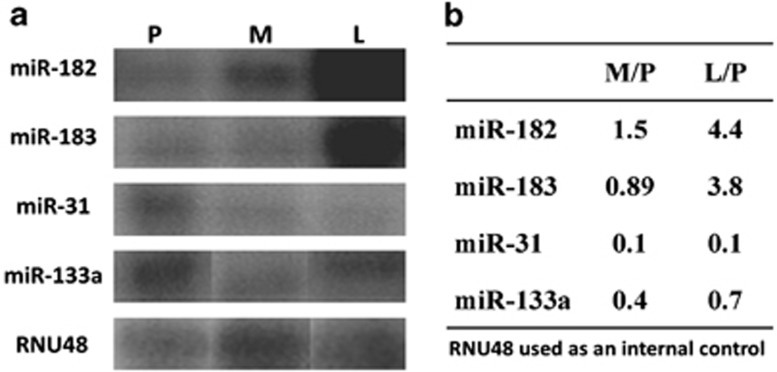
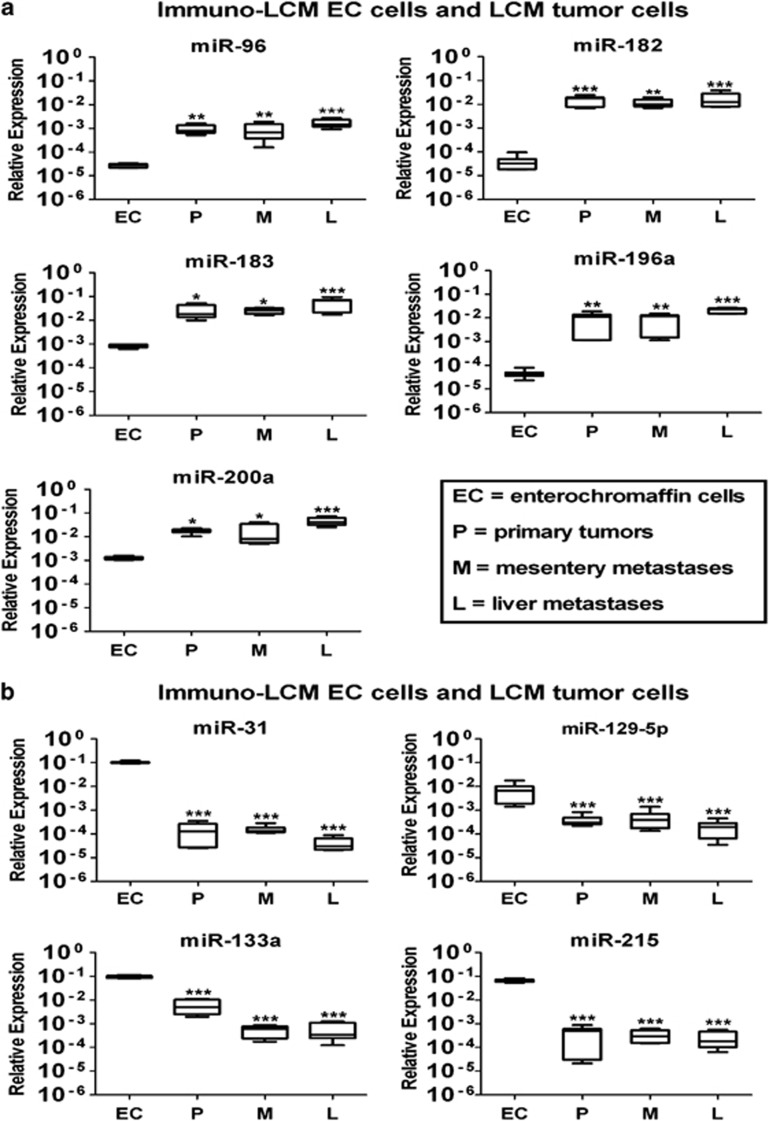
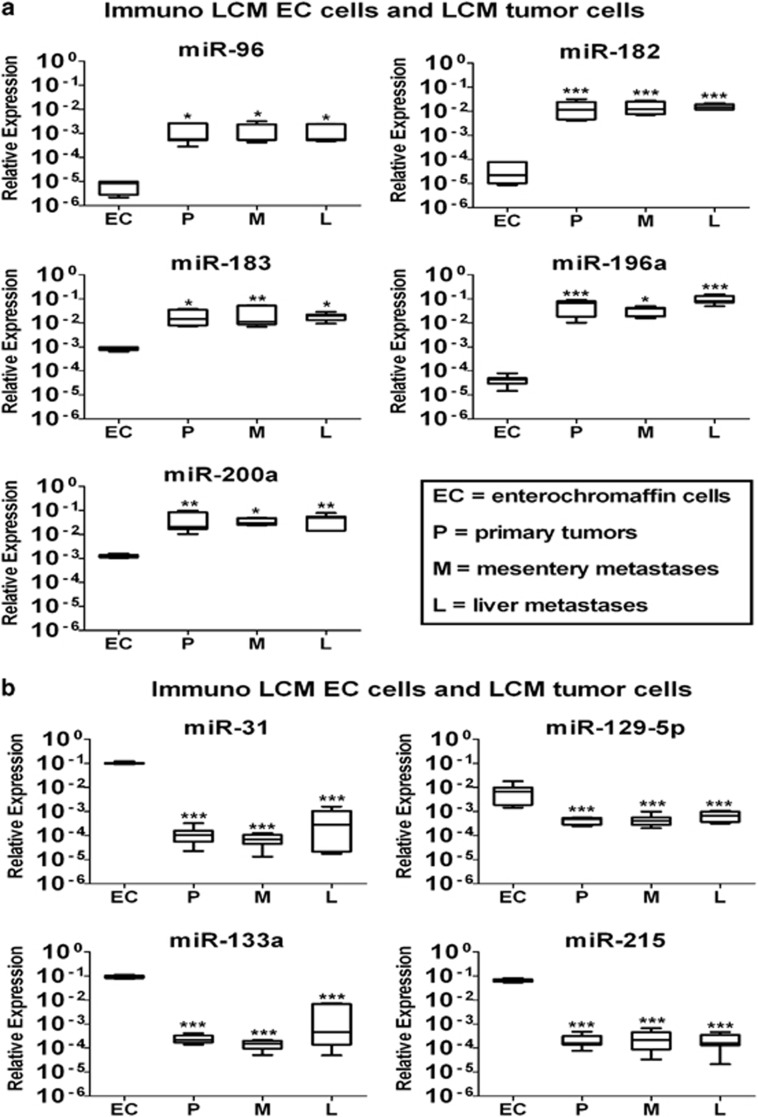
Well-differentiated small intestinal neuroendocrine tumors are rare malignancies. They arise from enterochromaffin cells and very little is known about differential microRNA (miRNA) expression. The aim of this study was to identify the miRNA profile of well-differentiated small intestinal neuroendocrine tumors, which may have a critical role in tumor development, progression and potentially develop miRNAs as novel clinical biomarkers. Specimens from two test groups, 24 small intestinal neuroendocrine tumor specimens at different stages of malignancy, are included in this study. Total RNA from the first test group, five primary tumors, five mesentery metastases and five liver metastases was hybridized onto the Affymetrix Genechip miRNA arrays to perform a genome-wide profile. The results were validated by using quantitative real-time PCR (QRT-PCR) and northern blot analyses. We then expanded the investigation to laser capture microdissected small intestinal neuroendocrine tumor cells and immuno-laser capture microdissected normal enterochromaffin cells of the first test group. Furthermore, a second test group, three primary tumors, three mesentery metastases and three liver metastases, was included in the study. Thus, two independent test groups validated the data by QRT-PCR. Moreover, we characterized nine miRNAs, five (miR-96, -182, -183, -196a and -200a), which are upregulated during tumor progression, whereas four (miR-31, -129-5p, -133a and -215) are downregulated. Several online software programs were used to predict potential miRNA target genes to map a number of putative target genes for the aberrantly regulated miRNAs, through an advanced and novel bioinformatics analysis. Our findings provide information about pivotal miRNAs, which may lead to further insights into tumorigenesis, progression mechanisms and novel therapeutic targets recognition.
Figures
Similar articles
-
MicroRNAs associated with small bowel neuroendocrine tumours and their metastases.Endocr Relat Cancer. 2016 Sep;23(9):711-26. doi: 10.1530/ERC-16-0044. Epub 2016 Jun 27. Endocr Relat Cancer. 2016. PMID: 27353039
-
miRNA profiling of small intestinal neuroendocrine tumors defines novel molecular subtypes and identifies miR-375 as a biomarker of patient survival.Mod Pathol. 2018 Aug;31(8):1302-1317. doi: 10.1038/s41379-018-0010-1. Epub 2018 Feb 27. Mod Pathol. 2018. PMID: 29487354
-
Overexpression of MicroRNA miR-7-5p Is a Potential Biomarker in Neuroendocrine Neoplasms of the Small Intestine.Neuroendocrinology. 2018;106(4):312-317. doi: 10.1159/000480121. Epub 2017 Aug 19. Neuroendocrinology. 2018. PMID: 28848144
-
Somatostatin Analogs Treated Small Intestinal Neuroendocrine Tumor Patients Circulating MicroRNAs.PLoS One. 2015 May 5;10(5):e0125553. doi: 10.1371/journal.pone.0125553. eCollection 2015. PLoS One. 2015. PMID: 25942502 Free PMC article.
-
A Comprehensive Assessment of the Role of miRNAs as Biomarkers in Gastroenteropancreatic Neuroendocrine Tumors.Neuroendocrinology. 2018;107(1):73-90. doi: 10.1159/000487326. Epub 2018 Mar 22. Neuroendocrinology. 2018. PMID: 29566385 Review.
Cited by
-
Gastroenteropancreatic neuroendocrine neoplasms: epidemiology, genetics, and treatment.Front Endocrinol (Lausanne). 2024 Sep 30;15:1424839. doi: 10.3389/fendo.2024.1424839. eCollection 2024. Front Endocrinol (Lausanne). 2024. PMID: 39411312 Free PMC article. Review.
-
Profiling of metastatic small intestine neuroendocrine tumors reveals characteristic miRNAs detectable in plasma.Oncotarget. 2017 Apr 7;8(33):54331-54344. doi: 10.18632/oncotarget.16908. eCollection 2017 Aug 15. Oncotarget. 2017. PMID: 28903345 Free PMC article.
-
Clinical Epigenetics of Neuroendocrine Tumors: The Road Ahead.Front Endocrinol (Lausanne). 2020 Dec 15;11:604341. doi: 10.3389/fendo.2020.604341. eCollection 2020. Front Endocrinol (Lausanne). 2020. PMID: 33384663 Free PMC article. Review.
-
NETs: organ-related epigenetic derangements and potential clinical applications.Oncotarget. 2016 Aug 30;7(35):57414-57429. doi: 10.18632/oncotarget.10598. Oncotarget. 2016. PMID: 27418145 Free PMC article. Review.
-
Alternative polyadenylation of tumor suppressor genes in small intestinal neuroendocrine tumors.Front Endocrinol (Lausanne). 2014 Apr 15;5:46. doi: 10.3389/fendo.2014.00046. eCollection 2014. Front Endocrinol (Lausanne). 2014. PMID: 24782827 Free PMC article.
References
-
- Bosman TF, Carneiro F, Hruban RH, et al. (eds).WHO Classification of Tumours of the Digestive System IARC Press: Lyon; 2010. p13
-
- Rindi G, Falconi M, Klersy C, et al. TNM staging of neoplasms of the endocrine pancreas: results from a large international cohort study. J Natl Cancer Inst. 2012;104:764–777. - PubMed
-
- Essand M, Leja J, Giandomenico V, et al. Oncolytic viruses for the treatment of neuroendocrine tumors. Horm Metab Res. 2011;43:877–883. - PubMed
-
- Rindi G, Wiedenmann B. Neuroendocrine neoplasms of the gut and pancreas: new insights. Nat Rev Endocrinol. 2012;8:54–64. - PubMed
-
- Cunningham JL, Diaz de Stahl T, Sjoblom T, et al. Common pathogenetic mechanism involving human chromosome 18 in familial and sporadic ileal carcinoid tumors. Genes Chromosomes Cancer. 2011;50:82–94. - PubMed
Publication types
MeSH terms
Substances
LinkOut - more resources
Full Text Sources
Other Literature Sources
Molecular Biology Databases
