

Molecular detection and targeting of EWSR1 fusion transcripts in soft tissue tumors
- PMID: 23329308
- PMCID: PMC3586390
- DOI: 10.1007/s12032-012-0412-8
Molecular detection and targeting of EWSR1 fusion transcripts in soft tissue tumors
Abstract
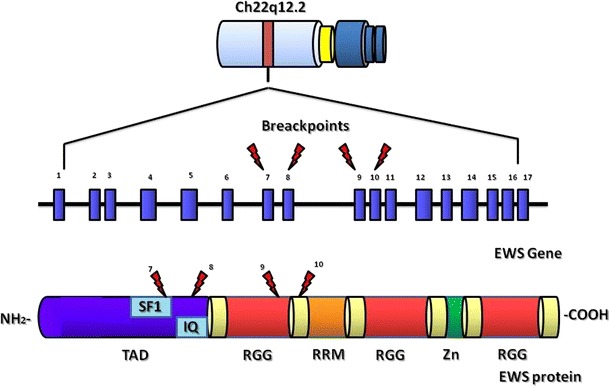
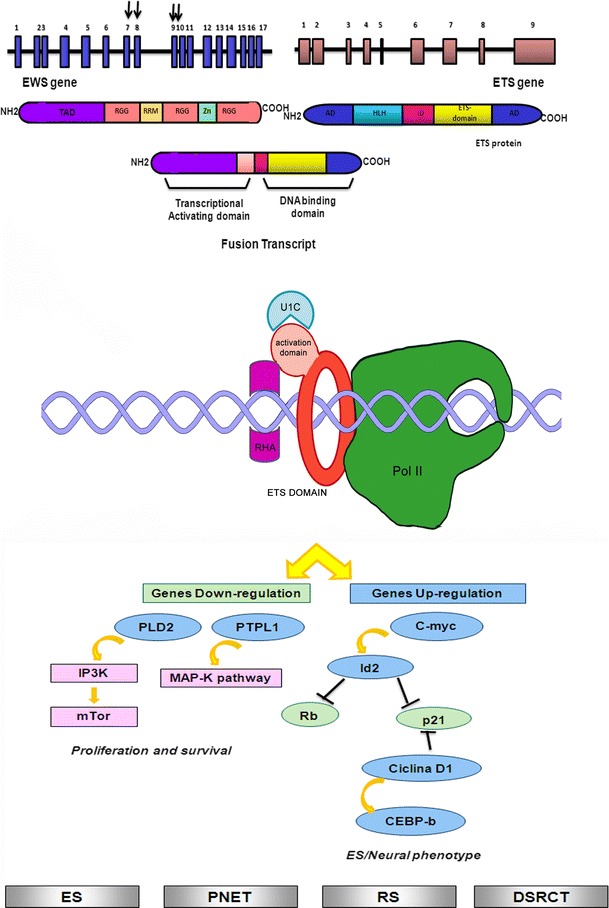
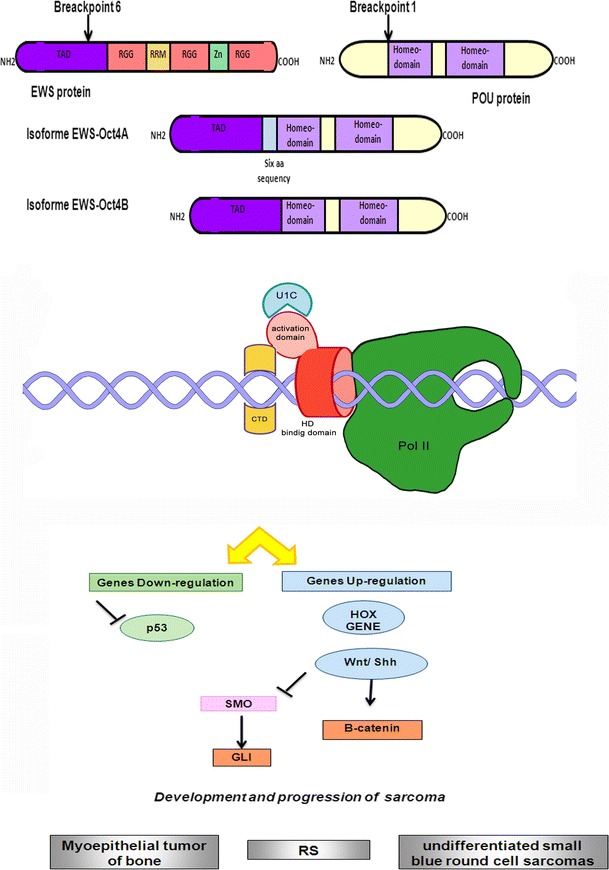
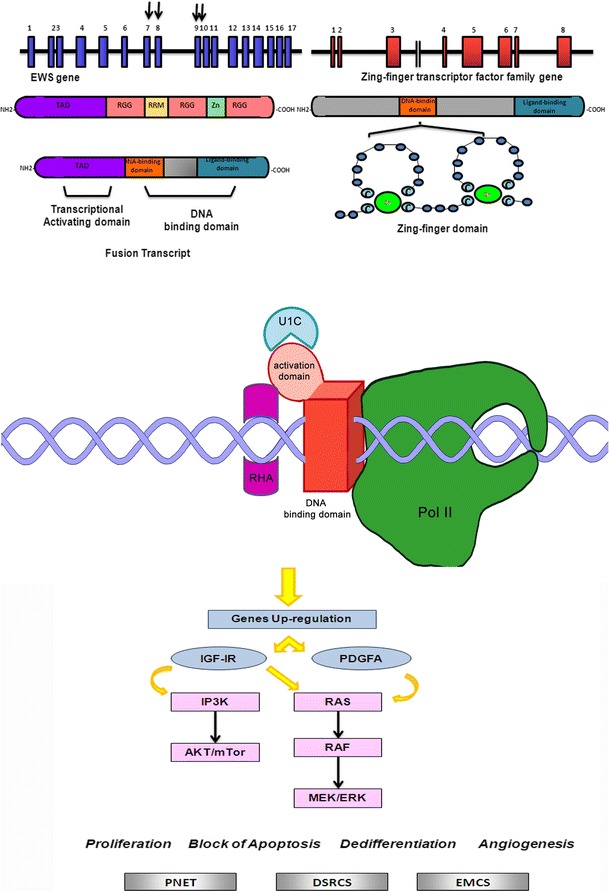
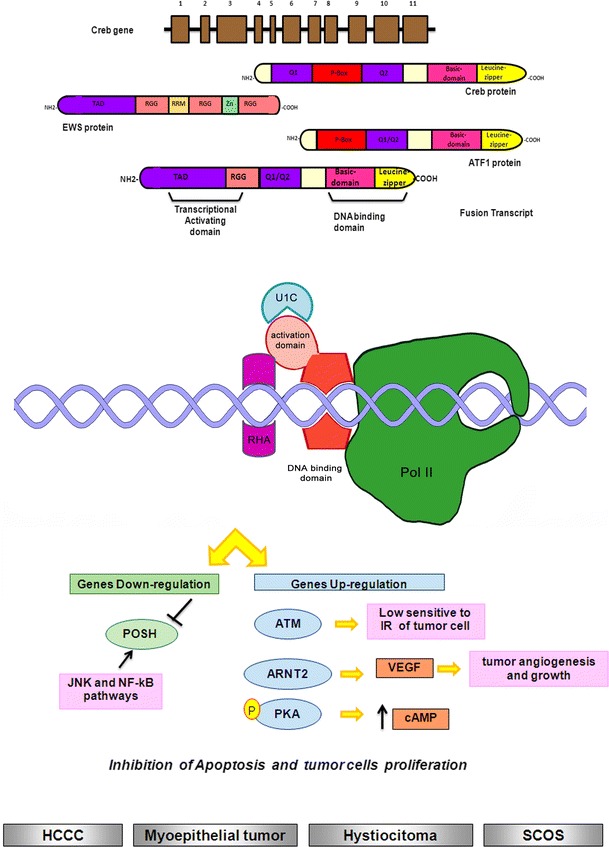
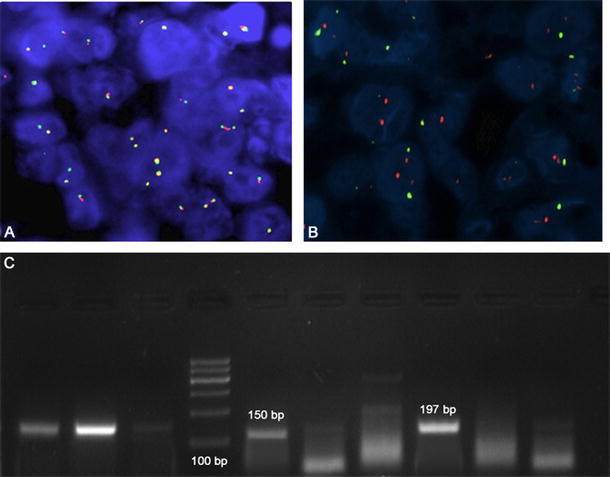
Soft tissue tumors are a heterogeneous group of tumors, traditionally classified according to morphology and histogenesis. Molecular classification divides sarcomas into two main categories: (a) sarcomas with specific genetic alterations and (b) sarcomas showing multiple complex karyotypic abnormalities without any specific pattern. Most chromosomal alterations are represented by translocations which are increasingly detected. The identification of fusion transcripts, in fact, not only support the diagnosis but also provides the basis for the development of new therapeutic strategies aimed at blocking aberrant activity of the chimeric proteins. One of the genes most susceptible to breakage/translocation in soft tissue tumors is represented by Ewing sarcoma breakpoint region 1 (EWSR1). This gene has a large number of fusion partners, mainly associated with the pathogenesis of Ewing's sarcoma but with other soft tissue tumors too. In this review, we illustrate the characteristics of this gene/protein, both in normal cellular physiology and in carcinogenesis. We describe the different fusion partners of EWSR1, the molecular pathways in which is involved and the main molecular biology techniques for the identification of fusion transcripts and for their inhibition.
Figures
Similar articles
-
Detection and characterization of EWSR1/ATF1 and EWSR1/CREB1 chimeric transcripts in clear cell sarcoma (melanoma of soft parts).Mod Pathol. 2009 Sep;22(9):1201-9. doi: 10.1038/modpathol.2009.85. Epub 2009 Jun 26. Mod Pathol. 2009. PMID: 19561568
-
EWSR1-POU5F1 fusion in soft tissue myoepithelial tumors. A molecular analysis of sixty-six cases, including soft tissue, bone, and visceral lesions, showing common involvement of the EWSR1 gene.Genes Chromosomes Cancer. 2010 Dec;49(12):1114-24. doi: 10.1002/gcc.20819. Genes Chromosomes Cancer. 2010. PMID: 20815032 Free PMC article.
-
Soft tissue tumors associated with EWSR1 translocation.Virchows Arch. 2010 Feb;456(2):219-34. doi: 10.1007/s00428-009-0854-3. Virchows Arch. 2010. PMID: 19936782 Review.
-
Identification of various exon combinations of the ews/fli1 translocation: an optimized RT-PCR method for paraffin embedded tissue -- a report by the CWS-study group.Klin Padiatr. 2004 Nov-Dec;216(6):315-22. doi: 10.1055/s-2004-832338. Klin Padiatr. 2004. PMID: 15565546
-
Cutaneous neoplasms showing EWSR1 rearrangement.Adv Anat Pathol. 2013 Mar;20(2):75-85. doi: 10.1097/PAP.0b013e31828625bf. Adv Anat Pathol. 2013. PMID: 23399793 Review.
Cited by
-
EWSR1 Rearrangement and CD99 Expression as Diagnostic Biomarkers for Ewing/PNET Sarcomas in a Moroccan Population.Dis Markers. 2018 Sep 18;2018:7971019. doi: 10.1155/2018/7971019. eCollection 2018. Dis Markers. 2018. PMID: 30319719 Free PMC article.
-
FISH molecular testing in cytological preparations from solid tumors.Mol Cytogenet. 2014 Aug 22;7:56. doi: 10.1186/s13039-014-0056-9. eCollection 2014. Mol Cytogenet. 2014. PMID: 25478010 Free PMC article.
-
In vivo CRISPR/Cas9 targeting of fusion oncogenes for selective elimination of cancer cells.Nat Commun. 2020 Oct 8;11(1):5060. doi: 10.1038/s41467-020-18875-x. Nat Commun. 2020. PMID: 33033246 Free PMC article.
-
A Case Series of Metastatic Malignant Gastrointestinal Neuroectodermal Tumors and Comprehensive Genomic Profiling Analysis of 20 Cases.Curr Oncol. 2022 Feb 21;29(2):1279-1297. doi: 10.3390/curroncol29020109. Curr Oncol. 2022. PMID: 35200608 Free PMC article. Review.
-
EWSR1/ELF5 induces acute myeloid leukemia by inhibiting p53/p21 pathway.Cancer Sci. 2016 Dec;107(12):1745-1754. doi: 10.1111/cas.13080. Epub 2016 Nov 25. Cancer Sci. 2016. PMID: 27627705 Free PMC article.
References
-
- Rossow KL, Janknecht R. The Ewing’s sarcoma gene product functions as a transcriptional activator. Cancer Res. 2001;61:2690–2695. - PubMed
Publication types
MeSH terms
Substances
LinkOut - more resources
Full Text Sources
Other Literature Sources
