

An in situ measurement of extracellular cysteamine, homocysteine, and cysteine concentrations in organotypic hippocampal slice cultures by integration of electroosmotic sampling and microfluidic analysis
- PMID: 23330713
- PMCID: PMC3621707
- DOI: 10.1021/ac302676q
An in situ measurement of extracellular cysteamine, homocysteine, and cysteine concentrations in organotypic hippocampal slice cultures by integration of electroosmotic sampling and microfluidic analysis
Abstract
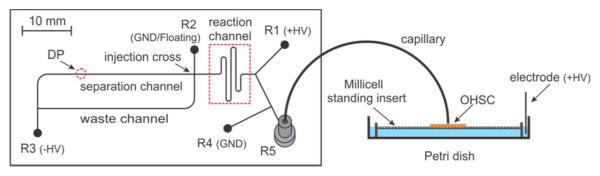
We demonstrate an all-electric sampling/derivatization/separation/detection system for the quantitation of thiols in tissue cultures. Extracellular fluid collected from rat organotypic hippocampal slice cultures (OHSCs) by electroosmotic flow through an 11 cm (length) × 50 μm (i.d.) sampling capillary is introduced to a simple microfluidic chip for derivatization, continuous flow-gated injection, separation, and detection. With the help of a fluorogenic, thiol-specific reagent, ThioGlo-1, we have successfully separated and detected the extracellular levels of free reduced cysteamine, homocysteine, and cysteine from OHSCs within 25 s in a 23 mm separation channel with a confocal laser-induced fluorescence (LIF) detector. Attention to the conductivities of the fluids being transported is required for successful flow-gated injections. When the sample conductivity is much higher than the run buffer conductivities, the electroosmotic velocities are such that there is less fluid coming by electroosmosis into the cross from the sample/reagent channel than is leaving by electroosmosis into the separation and waste channels. The resulting decrease in the internal fluid pressure in the injection cross pulls flow from the gated channel. This process may completely shut down the gated injection. Using a glycylglycine buffer with physiological osmolarity but only 62% of physiological conductivity and augmenting the conductivity of the run buffers solved this problem. Quantitation is by standard additions. Concentrations of cysteamine, homocysteine, and cysteine in the extracellular space of OHSCs are 10.6 ± 1.0 nM (n = 70), 0.18 ± 0.01 μM (n = 53), and 11.1 ± 1.2 μM (n = 70), respectively. This is the first in situ quantitative estimation of endogenous cysteamine in brain tissue. Extracellular levels of homocysteine and cysteine are comparable with other reported values.
Figures


Similar articles
-
Integrated electroosmotic perfusion of tissue with online microfluidic analysis to track the metabolism of cystamine, pantethine, and coenzyme A.Anal Chem. 2013 Dec 17;85(24):12020-7. doi: 10.1021/ac403005z. Epub 2013 Nov 22. Anal Chem. 2013. PMID: 24215585 Free PMC article.
-
Minimizing tissue damage in electroosmotic sampling.Anal Chem. 2010 Aug 1;82(15):6370-6. doi: 10.1021/ac101271r. Anal Chem. 2010. PMID: 20698578 Free PMC article.
-
Electroosmotic perfusion of tissue: sampling the extracellular space and quantitative assessment of membrane-bound enzyme activity in organotypic hippocampal slice cultures.Anal Bioanal Chem. 2014 Oct;406(26):6455-68. doi: 10.1007/s00216-014-8067-2. Epub 2014 Aug 29. Anal Bioanal Chem. 2014. PMID: 25168111 Free PMC article. Review.
-
Electroosmotic sampling. Application to determination of ectopeptidase activity in organotypic hippocampal slice cultures.Anal Chem. 2010 Aug 1;82(15):6377-83. doi: 10.1021/ac1012706. Anal Chem. 2010. PMID: 20669992 Free PMC article.
-
Determination of endogenous thiols and thiol drugs in urine by HPLC with ultraviolet detection.J Chromatogr B Analyt Technol Biomed Life Sci. 2009 Oct 15;877(28):3300-8. doi: 10.1016/j.jchromb.2009.03.038. Epub 2009 Mar 31. J Chromatogr B Analyt Technol Biomed Life Sci. 2009. PMID: 19386557 Review.
Cited by
-
Assessment of tissue viability following electroosmotic push-pull perfusion from organotypic hippocampal slice cultures.ACS Chem Neurosci. 2013 May 15;4(5):849-57. doi: 10.1021/cn4000814. Epub 2013 May 2. ACS Chem Neurosci. 2013. PMID: 23639590 Free PMC article.
-
Electroosmotic Perfusion, External Microdialysis: Simulation and Experiment.ACS Chem Neurosci. 2023 Jul 19;14(14):2499-2508. doi: 10.1021/acschemneuro.3c00057. Epub 2023 Jun 28. ACS Chem Neurosci. 2023. PMID: 37379416 Free PMC article.
-
PDMS/glass hybrid device with a reusable carbon electrode for on-line monitoring of catecholamines using microdialysis sampling coupled to microchip electrophoresis with electrochemical detection.Electrophoresis. 2018 Feb;39(3):462-469. doi: 10.1002/elps.201700211. Epub 2017 Aug 21. Electrophoresis. 2018. PMID: 28737835 Free PMC article.
-
Integrated electroosmotic perfusion of tissue with online microfluidic analysis to track the metabolism of cystamine, pantethine, and coenzyme A.Anal Chem. 2013 Dec 17;85(24):12020-7. doi: 10.1021/ac403005z. Epub 2013 Nov 22. Anal Chem. 2013. PMID: 24215585 Free PMC article.
-
Electrokinetic Convection-Enhanced Delivery of Solutes to the Brain.ACS Chem Neurosci. 2020 Jul 15;11(14):2085-2093. doi: 10.1021/acschemneuro.0c00037. Epub 2020 Jul 6. ACS Chem Neurosci. 2020. PMID: 32559365 Free PMC article.
References
-
- Manz A, Graber N, Widmer HM. Sens. Actuators, B. 1990;1:244–248.
-
- Cellar NA, Burns ST, Meiners JC, Chen H, Kennedy RT. Anal. Chem. 2005;77:7067–7073. - PubMed
-
- Sandlin ZD, Shou MS, Shackman JG, Kennedy RT. Anal. Chem. 2005;77:7702–7708. - PubMed
-
- Nandi P, Desaias DP, Lunte SM. Electrophoresis. 2010;31:1414–1422. - PubMed
Publication types
MeSH terms
Substances
Grants and funding
LinkOut - more resources
Full Text Sources
Other Literature Sources
