. 2013 Jan 18:7:7.
doi: 10.1186/1752-0509-7-7.

SignaLink 2 - a signaling pathway resource with multi-layered regulatory networks

Affiliations

SignaLink 2 - a signaling pathway resource with multi-layered regulatory networks

Dávid Fazekas et al. BMC Syst Biol. .

Abstract

Background: Signaling networks in eukaryotes are made up of upstream and downstream subnetworks. The upstream subnetwork contains the intertwined network of signaling pathways, while the downstream regulatory part contains transcription factors and their binding sites on the DNA as well as microRNAs and their mRNA targets. Currently, most signaling and regulatory databases contain only a subsection of this network, making comprehensive analyses highly time-consuming and dependent on specific data handling expertise. The need for detailed mapping of signaling systems is also supported by the fact that several drug development failures were caused by undiscovered cross-talk or regulatory effects of drug targets. We previously created a uniformly curated signaling pathway resource, SignaLink, to facilitate the analysis of pathway cross-talks. Here, we present SignaLink 2, which significantly extends the coverage and applications of its predecessor.

Description: We developed a novel concept to integrate and utilize different subsections (i.e., layers) of the signaling network. The multi-layered (onion-like) database structure is made up of signaling pathways, their pathway regulators (e.g., scaffold and endocytotic proteins) and modifier enzymes (e.g., phosphatases, ubiquitin ligases), as well as transcriptional and post-transcriptional regulators of all of these components. The user-friendly website allows the interactive exploration of how each signaling protein is regulated. The customizable download page enables the analysis of any user-specified part of the signaling network. Compared to other signaling resources, distinctive features of SignaLink 2 are the following: 1) it involves experimental data not only from humans but from two invertebrate model organisms, C. elegans and D. melanogaster; 2) combines manual curation with large-scale datasets; 3) provides confidence scores for each interaction; 4) operates a customizable download page with multiple file formats (e.g., BioPAX, Cytoscape, SBML). Non-profit users can access SignaLink 2 free of charge at http://SignaLink.org.

Conclusions: With SignaLink 2 as a single resource, users can effectively analyze signaling pathways, scaffold proteins, modifier enzymes, transcription factors and miRNAs that are important in the regulation of signaling processes. This integrated resource allows the systems-level examination of how cross-talks and signaling flow are regulated, as well as provide data for cross-species comparisons and drug discovery analyses.


Figures
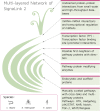
Figure 1
Figure 1
The multi-layered structure of SignaLink 2. Layers are from different sources and contain different types of interactions. The image of an onion is used to illustrate this structure. The core of the database contains the interactions between pathway member proteins. In the first layer these proteins are connected with pathway regulators, such as scaffold and endocytotic proteins. The next two layers contain the first neighbor interactors of these proteins. The interactors have a predicted enzymatic effect (second layer) or a known physical interaction (third layer) to the members of the core or the first layer. The fourth and the fifth layers contain the transcription factors (TFs) and miRNA regulators of the already listed proteins, respectively. The fifth layer also contains the TFs of these miRNAs.
Figure 2
Figure 2
The construction and structure of SignaLink 2. First, with manual curation we updated previous pathway data, extended the set of pathway proteins and included information on scaffold and endocytotic proteins. Then, we integrated the protein-protein interactions affecting proteins in the manually curated core of SignaLink 2. With this step we also imported first neighbor proteins of the pathway member and pathway regulator proteins. Then, we integrated the transcription factors (TF) that regulate all these proteins. Finally, we integrated miRNAs and their interactions with the mRNAs of all the already inserted proteins. We also added the TFs of the imported miRNAs.
Figure 3
Figure 3
Confidence scores for human protein-protein interactions (PPIs). a) Confidence scores calculated based on a GO semantic similarity score [36]. We determined cut-off scores at 0.2 and 0.6 to divide low-, medium- and high-confidence PPIs. b) For PPIs in humans where detailed information was available for the interacting proteins, we also calculated another confidence score with the PRINCESS PPI-evaluation tool [37]. By default, PRINCESS sets it cut-off score at 2.0. More than the half (52.9%) of the evaluated PPIs were above this value.
Figure 4
Figure 4
The SQL database scheme of SignaLink 2. The core of the database is the interaction table. Interactions can be between proteins or one protein and one miRNA. Each record in the protein or mirna tables represents one real protein or miRNA, and one real entity represented only by one record. There can be more than one interaction between two nodes, but only one within each layer. Within layers, interactions have sources (what databases are they originated from) and reference annotations (what publications do contain information about them) Interaction_source table connects interaction and source tables, while interaction_reference table connects interaction and reference tables. Each interaction has the attributes whether it is direct or indirect (interaction.is_direct), directed or undirected (interaction.is_directed), stimulatory or inhibitory (interaction.is_stimulation) stored in the interaction table. The interaction table is connected to the score_interaction table, in which binding and confidence scores are stores. Other supplementary tables contain names and IDs of proteins. See the main text for details.
Figure 5
Figure 5
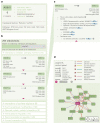
Functionality of the protein datasheet at the SignaLink.org website. a) This box contains basic information about the protein, AXIN1: references to other databases, topological features and pathway memberships. b) The protein datasheet lists all interactions of AXIN1, grouped by layers. Expanding one layer, users are able to browse the list of interactions. c) In this view the properties of the interactions (direction, direct or indirect, stimulatory or inhibitory) are visible. More details (database sources of the interaction, literature references and scores) can be accessed by one click. d) An interactive network of first neighbors is available, visualized by the CytoscapeWeb plugin [38].
Figure 6
Figure 6
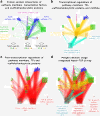
Visualization of the multi-level cross-talk between Notch and TGF-β pathways to illustrate the capabilities of a SignaLink 2 download file. In each part of the figure, text boxes show the color legend of the nodes. Number of components is listed in parentheses. a) Protein-protein interactions of Notch and TGF-β pathway members, transcription factors, scaffold and endocytotic proteins. Interactions between pathway members and of transcription factors (TFs) are shown with blue edges, while the interaction of scaffold and endocytotic proteins are shown with green edges. b) Transcriptional regulations of Notch and TGF-β pathway members, TFs, scaffold/endocytotic proteins and miRNAs. Transcriptional regulations of proteins and miRNAs are shown with orange and light blue edges, respectively. Those TFs that regulate miRNAs are highlighted with a light blue border. c) Post-transcriptional regulations of Notch and TGF-β pathway members, TFs and scaffold/endocytotic proteins. Post-transcriptional connection between miRNAs and their target proteins is shown with red edges. d) An integrated Notch – TGF-β map. This is a merged network image of the previous three networks. With textboxes we highlighted cross-talk regulating miRNAs. See the main text for the details of each network. The networks were analyzed and visualized with Cytoscape [69].

References

    1. Korcsmaros T, Farkas IJ, Szalay MS, Rovo P, Fazekas D, Spiro Z, Bode C, Lenti K, Vellai T, Csermely P. Uniformly curated signaling pathways reveal tissue-specific cross-talks and support drug target discovery. Bioinformatics. 2010;26:2042–2050. doi: 10.1093/bioinformatics/btq310. - DOI - PubMed
    1. Haney S, Bardwell L, Nie Q. Ultrasensitive responses and specificity in cell signaling. BMC Syst Biol. 2010;4:119. doi: 10.1186/1752-0509-4-119. - DOI - PMC - PubMed
    1. Kholodenko BN. Cell-signalling dynamics in time and space. Nat Rev Mol Cell Biol. 2006;7:165–176. doi: 10.1038/nrm1838. - DOI - PMC - PubMed
    1. Grabbe C, Husnjak K, Dikic I. The spatial and temporal organization of ubiquitin networks. Nat Rev Mol Cell Biol. 2011;12:295–307. - PMC - PubMed
    1. Bhattacharyya RP, Remenyi A, Yeh BJ, Lim WA. Domains, motifs, and scaffolds: the role of modular interactions in the evolution and wiring of cell signaling circuits. Annu Rev Biochem. 2006;75:655–680. doi: 10.1146/annurev.biochem.75.103004.142710. - DOI - PubMed

Publication types

LinkOut - more resources