Clinical Trial
. 2013 Jan 18:10:8.
doi: 10.1186/1742-4690-10-8.

Restriction of V3 region sequence divergence in the HIV-1 envelope gene during antiretroviral treatment in a cohort of recent seroconverters

Collaborators, Affiliations
Clinical Trial

Restriction of V3 region sequence divergence in the HIV-1 envelope gene during antiretroviral treatment in a cohort of recent seroconverters

Astrid Gall et al. Retrovirology. .

Abstract

Background: Dynamic changes in Human Immunodeficiency Virus 1 (HIV-1) sequence diversity and divergence are associated with immune control during primary infection and progression to AIDS. Consensus sequencing or single genome amplification sequencing of the HIV-1 envelope (env) gene, in particular the variable (V) regions, is used as a marker for HIV-1 genome diversity, but population diversity is only minimally, or semi-quantitatively sampled using these methods.

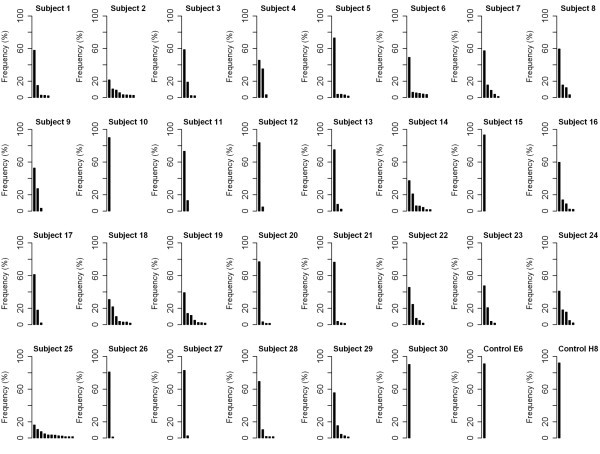
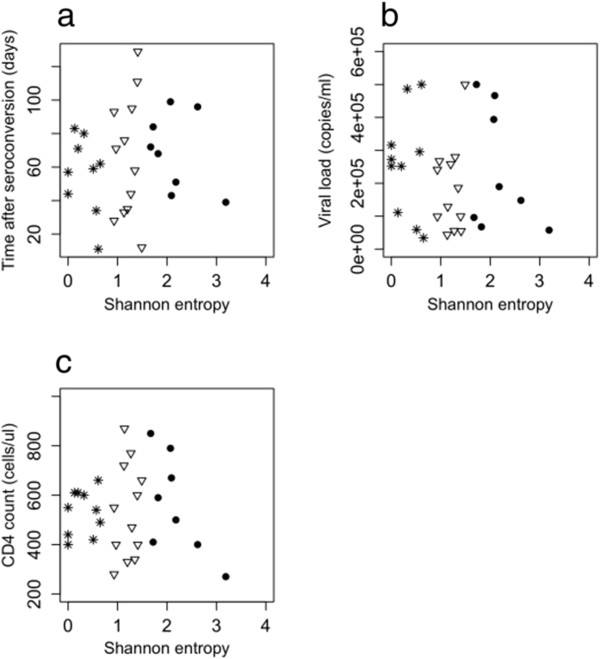
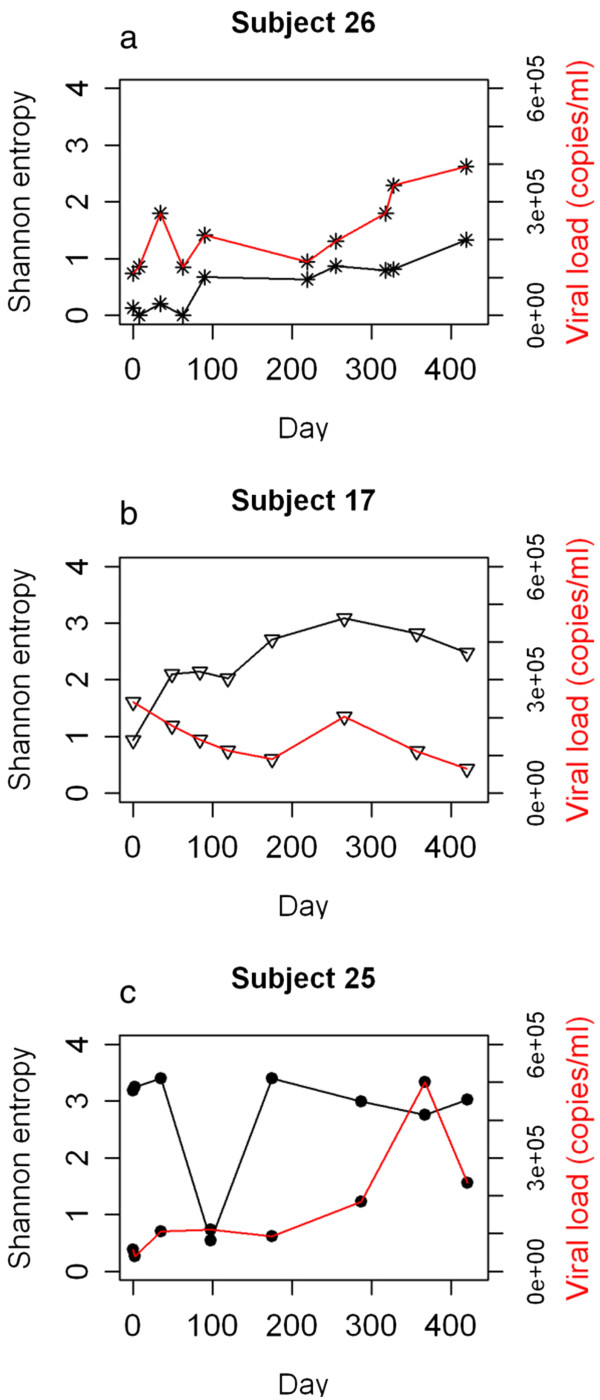
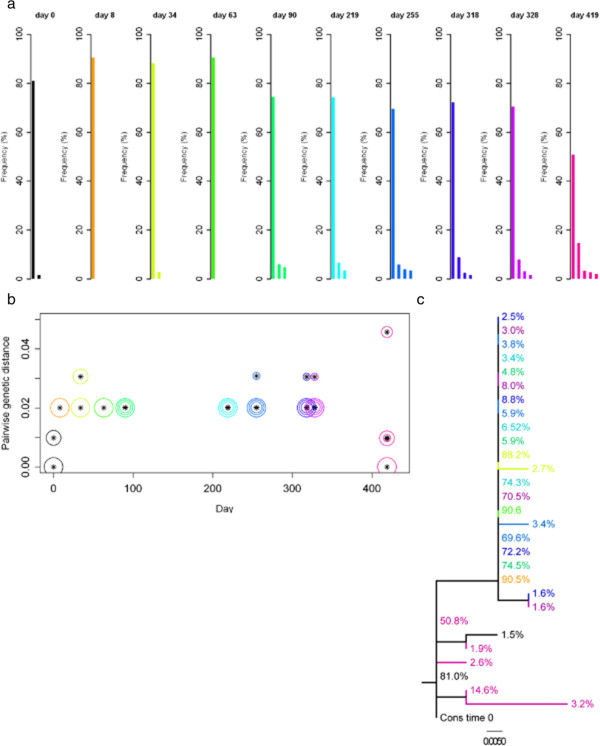
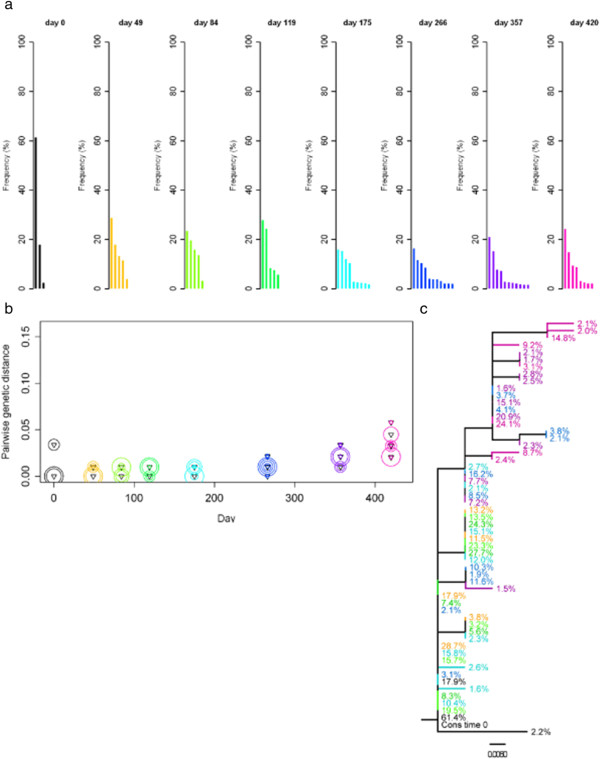
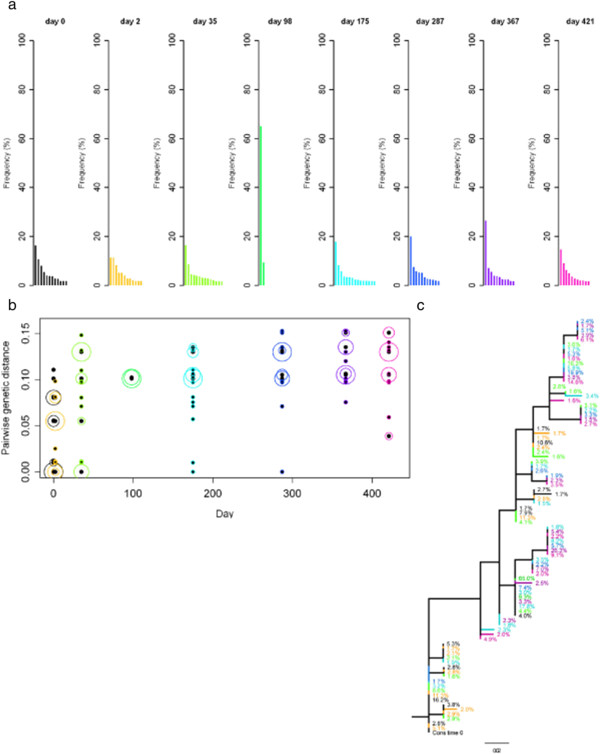
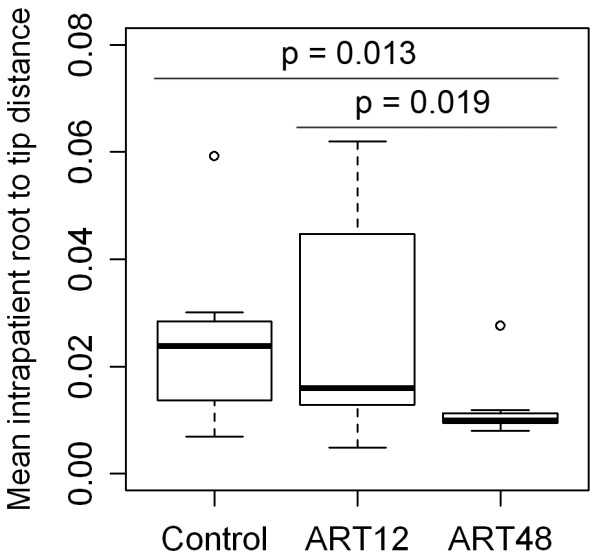
Results: Here we use second generation deep sequencing to determine inter-and intra-patient sequence heterogeneity and to quantify minor variants in a cohort of individuals either receiving or not receiving antiretroviral treatment following seroconversion; the SPARTAC trial. We show, through a cross-sectional study of sequence diversity of the env V3 in 30 antiretroviral-naive patients during primary infection that considerable population structure diversity exists, with some individuals exhibiting highly constrained plasma virus diversity. Diversity was independent of clinical markers (viral load, time from seroconversion, CD4 cell count) of infection. Serial sampling over 60 weeks of non-treated individuals that define three initially different diversity profiles showed that complex patterns of continuing HIV-1 sequence diversification and divergence could be readily detected. Evidence for minor sequence turnover, emergence of new variants and re-emergence of archived variants could be inferred from this analysis. Analysis of viral divergence over the same time period in patients who received short (12 weeks, ART12) or long course antiretroviral therapy (48 weeks, ART48) and a non-treated control group revealed that ART48 successfully suppressed viral divergence while ART12 did not have a significant effect.

Conclusions: Deep sequencing is a sensitive and reliable method for investigating the diversity of the env V3 as an important component of HIV-1 genome diversity. Detailed insights into the complex early intra-patient dynamics of env V3 diversity and divergence were explored in antiretroviral-naïve recent seroconverters. Long course antiretroviral therapy, initiated soon after seroconversion and administered for 48 weeks, restricts HIV-1 divergence significantly. The effect of ART12 and ART48 on clinical markers of HIV infection and progression is currently investigated in the SPARTAC trial.


Figures

Figure 1
Figure 1
Sequence variants of the env V3 in patients at primary HIV infection and control samples. Major and minor sequence variants found in 30 subjects at primary infection with HIV-1 subtype B and two control samples, E6 and H8 (in vitro transcribed RNA from cloned and sequenced env genes), are shown. Each bar represents one unique sequence variant. Only variants with frequencies above the 1.5% cut-off are displayed.
Figure 2
Figure 2
Correlation of the Shannon Entropy with clinical markers of HIV infection. The correlation with (a) the time after seroconversion, (b) the viral load, and (c) the CD4 cell count is shown for 30 subjects at primary infection with HIV. As the time to seroconversion is not known for subject 15, it is not included in (a). Patients were classified into three groups based on the sequence diversity. Group 1 is defined by a low sequence diversity (Shannon Entropy 0–0.75) and is shown as stars. Group 2 is defined by a medium sequence diversity (Shannon Entropy 0.75–1.5) and is shown as triangles. Group 3 is defined by a high sequence diversity (Shannon Entropy > 1.5) and is shown as dots.
Figure 3
Figure 3
Diversity and viral load over a time of ~ 60 weeks for three subjects. The Shannon Entropy is used as a measure for sequence diversity. Results are shown for (a) subject 26, with low sequence diversity, (b) subject 17, with medium sequence diversity, and (c) subject 25, with high sequence diversity at primary HIV infection.
Figure 4
Figure 4
Sequence variants of the env V3, divergence and Neighbor-joining tree for subject 26. Samples over a time of ~ 60 weeks were analysed; with day 0 shown in black, and a rainbow colour scheme ranging from orange to pink applied to the remaining time points. (a) Sequence variants of the env V3. Each bar stands for one unique sequence variant. Only variants with frequencies above the 1.5% cut-off are displayed. (b) Divergence of env V3 sequence variants. Divergence is shown as the pairwise genetic distance (number of nucleotide substitutions per site) of a sequence variant at a given time from the consensus sequence at time 0. Genetic distances were estimated under the General Time Reversible model of nucleotide substitution, with proportion of invariable sites and gamma-distributed rate heterogeneity (GTR + I + G). Sizes of the circles around the symbols represent the frequencies of the sequence variants. The largest circle at each time point marks the major variant; the 2nd, 3rd and 4th most abundant variants are shown with gradually smaller circles; from the 5th most abundant variant circles have the same size. Note that the scale of the y-axis in this figure is different from Figures 5 and 6. (c) Neighbor-joining tree of env V3 sequence variants. The tree was reconstructed under the GTR + I + G model of nucleotide substitution. Branches are labeled with frequencies of sequence variants as depicted in (a). The scale bar represents the number of nucleotide substitutions per site.
Figure 5
Figure 5
Sequence variants of the env V3, divergence and Neighbor-joining tree for subject 17. Samples over a time of ~ 60 weeks were analysed; with day 0 shown in black, and a rainbow colour scheme ranging from orange to pink applied to the remaining time points. The remaining details are as per Figure 4.
Figure 6
Figure 6
Sequence variants of the env V3, divergence and Neighbor-joining tree for subject 25. Samples over a time of ~ 60 weeks were analysed; with day 0 shown in black, and a rainbow colour scheme ranging from orange to pink applied to the remaining time points. The remaining details are as per Figure 4.
Figure 7
Figure 7
Influence of ART on the divergence of the viral population. Each group contains 10 individuals. Control, non-treated individuals; ART12, short course antiretroviral therapy (12 weeks); ART48, long course antiretroviral therapy (48 weeks). The divergence is shown as mean intra-patient root to tip distance, defined as genetic distance (in number of nucleotide substitutions per site) from each sequence to the root. Distances were calculated under the uncorrected (p) model of nucleotide substitution (number of substitutions accumulated along the path from the tip to the root, divided by the length of the alignment). Root to tip distances were analysed over a time of ~ 60 weeks after primary infection. The significance of differences in the mean between groups was tested by Wilcoxon rank sum tests. There is no significant difference between the control group and ART12 (p = 0.780).

References

    1. Keele BF, Giorgi EE, Salazar-Gonzalez JF, Decker JM, Pham KT, Salazar MG, Sun C, Grayson T, Wang S, Li H. et al.Identification and characterization of transmitted and early founder virus envelopes in primary HIV-1 infection. Proc Natl Acad Sci U S A. 2008;105:7552–7557. doi: 10.1073/pnas.0802203105. - DOI - PMC - PubMed
    1. Ganusov VV, Goonetilleke N, Liu MK, Ferrari G, Shaw GM, McMichael AJ, Borrow P, Korber BT, Perelson AS. Fitness costs and diversity of CTL response determine the rate of CTL escape during the acute and chronic phases of HIV infection. J Virol. 2011;85:10518–10528. doi: 10.1128/JVI.00655-11. - DOI - PMC - PubMed
    1. Fischer W, Ganusov VV, Giorgi EE, Hraber PT, Keele BF, Leitner T, Han CS, Gleasner CD, Green L, Lo CC. et al.Transmission of single HIV-1 genomes and dynamics of early immune escape revealed by ultra-deep sequencing. PLoS One. 2010;5:e12303. doi: 10.1371/journal.pone.0012303. - DOI - PMC - PubMed
    1. Love TM, Thurston SW, Keefer MC, Dewhurst S, Lee HY. Mathematical modeling of ultradeep sequencing data reveals that acute CD8+ T-lymphocyte responses exert strong selective pressure in simian immunodeficiency virus-infected macaques but still fail to clear founder epitope sequences. J Virol. 2010;84:5802–5814. doi: 10.1128/JVI.00117-10. - DOI - PMC - PubMed
    1. Shankarappa R, Margolick JB, Gange SJ, Rodrigo AG, Upchurch D, Farzadegan H, Gupta P, Rinaldo CR, Learn GH, He X. et al.Consistent viral evolutionary changes associated with the progression of human immunodeficiency virus type 1 infection. J Virol. 1999;73:10489–10502. - PMC - PubMed

Publication types