Comparative Study
. 2013 Jan 18:6:20.
doi: 10.1186/1756-3305-6-20.

How malaria models relate temperature to malaria transmission

Affiliations
Comparative Study

How malaria models relate temperature to malaria transmission

Torleif Markussen Lunde et al. Parasit Vectors. .

Abstract

Background: It is well known that temperature has a major influence on the transmission of malaria parasites to their hosts. However, mathematical models do not always agree about the way in which temperature affects malaria transmission.

Methods: In this study, we compared six temperature dependent mortality models for the malaria vector Anopheles gambiae sensu stricto. The evaluation is based on a comparison between the models, and observations from semi-field and laboratory settings.

Results: Our results show how different mortality calculations can influence the predicted dynamics of malaria transmission.

Conclusions: With global warming a reality, the projected changes in malaria transmission will depend on which mortality model is used to make such predictions.


Figures
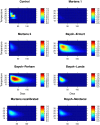
Figure 1
Figure 1
The percentage of infectious mosquitoes over time and temperature.
Figure 2
Figure 2
Integral of infectious mosquitoes over temperature. Models: Bayoh-Ermert (blue solid line), Martens 1 (black solid line), Martens 2 (blue dashed line), Martens 3 (grey solid line), Bayoh-Parham (red solid line), Lunde (black dashed line), and the mean value of the five models (green thick solid line). Black dots indicate the results for the control, and vertical lines show the temperature at which the maximum can be found (equation 12).
Figure 3
Figure 3
Taylor diagram. The model names are indicated next to the symbols. The x and y axes represent the standard deviations, the curved grey lines are the root mean square, while the dashed lines represent the Pearson correlation coefficient.
Figure 4
Figure 4
R0 as a function of temperature calculated using equation 2 in Mordecai et al. [[26]], but with different mortality models. Blue dots represent optimal temperatures using the methods in this paper, and red crosses is the optimal temperature using the methods from Mordecai et al.[26].

References

    1. Hansen J, Sato M, Ruedy R. Perception of climate change. Proc Natl Acad Sci USA. 2012;109:E2415—2423. - PMC - PubMed
    1. Intergovernmental Panel on Climate Change. Fourth Assessment Report: Climate Change 2007: Working Group I Report: The Physical Science Basis. Geneva: IPCC; 2007.
    1. Gething PW, Smith DL, Patil AP, Tatem AJ, Snow RW, Hay SI. Climate change and the global malaria recession. Nature. 2010;465:342–345. doi: 10.1038/nature09098. - DOI - PMC - PubMed
    1. Sinka ME, Bangs MJ, Manguin S, Rubio-Palis Y, Chareonviriyaphap T, Coetzee M, Mbogo CM, Hemingway J, Patil AP, Temperley WH, Gething PW, Kabaria CW, Burkot TR, Harbach RE, Hay SI. A global map of dominant malaria vectors. Parasit Vectors. 2012;5:69. doi: 10.1186/1756-3305-5-69. - DOI - PMC - PubMed
    1. Sinka ME, Bangs MJ, Manguin S, Coetzee M, Mbogo CM, Hemingway J, Patil AP, Temperley WH, Gething PW, Kabaria CW, Okara RM, Van Boeckel T, Godfray HCJ, Harbach RE, Hay SI. The dominant Anopheles vectors of human malaria in Africa, Europe and the Middle East: occurrence data, distribution maps and bionomic precis. Parasit Vectors. 2010;3:117. doi: 10.1186/1756-3305-3-117. - DOI - PMC - PubMed

Publication types