. 2013 Jan 8;104(1):268-78.
doi: 10.1016/j.bpj.2012.11.007. Epub 2013 Jan 8.

Quantification of transmembrane currents during action potential propagation in the heart

Affiliations

Quantification of transmembrane currents during action potential propagation in the heart

Richard A Gray et al. Biophys J. .

Abstract

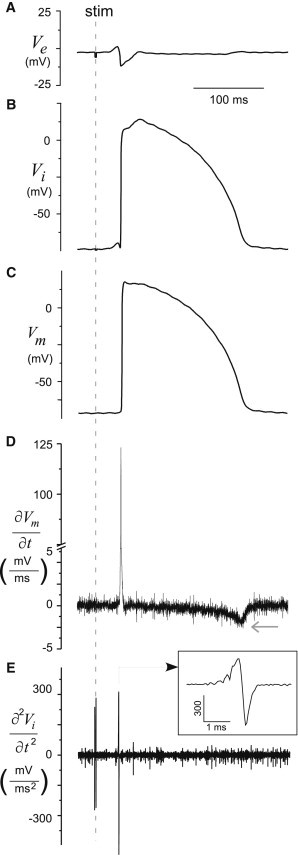
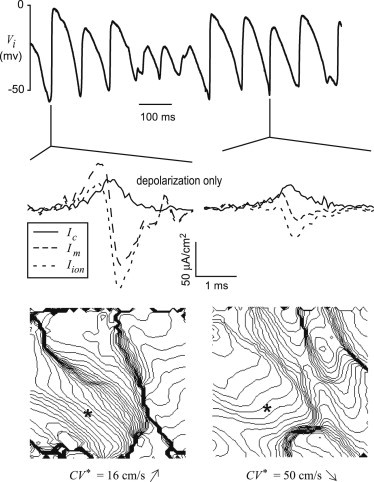
The measurement, quantitative analysis, theory, and mathematical modeling of transmembrane potential and currents have been an integral part of the field of electrophysiology since its inception. Biophysical modeling of action potential propagation begins with detailed ionic current models for a patch of membrane within a distributed cable model. Voltage-clamp techniques have revolutionized clinical electrophysiology via the characterization of the transmembrane current gating variables; however, this kinetic information alone is insufficient to accurately represent propagation. Other factors, including channel density, membrane area, surface/volume ratio, axial conductivities, etc., are also crucial determinants of transmembrane currents in multicellular tissue but are extremely difficult to measure. Here, we provide, to our knowledge, a novel analytical approach to compute transmembrane currents directly from experimental data, which involves high-temporal (200 kHz) recordings of intra- and extracellular potential with glass microelectrodes from the epicardial surface of isolated rabbit hearts during propagation. We show for the first time, to our knowledge, that during stable planar propagation the biphasic total transmembrane current (I(m)) dipole density during depolarization was ∼0.25 ms in duration and asymmetric in amplitude (peak outward current was ∼95 μA/cm(2) and peak inward current was ∼140 μA/cm(2)), and the peak inward ionic current (I(ion)) during depolarization was ∼260 μA/cm(2) with duration of ∼1.0 ms. Simulations of stable propagation using the ionic current versus transmembrane potential relationship fit from the experimental data reproduced these values better than traditional ionic models. During ventricular fibrillation, peak I(m) was decreased by 50% and peak I(ion) was decreased by 70%. Our results provide, to our knowledge, novel quantitative information that complements voltage- and patch-clamp data.


Figures

Figure 1
Figure 1
Isochrone maps from an isolated rabbit heart indicating the position of the wavefront at 1 ms intervals for propagation in the longitudinal (A) and transverse (B) directions. Wave propagation was initiated just outside the field of view (indicated by an asterisk) and the position of the microelectrode is indicated by M. The isochrone maps show nearly planar propagation through this region because the isochrones are nearly straight and parallel to each other.
Figure 2
Figure 2
Microelectrode data. (A) Ve and (B) Vi recordings, (C) Vm signal computed as difference of Vi and Ve, (D) the first derivative of the Vm, and (D) the second derivative of the Vi signal from a glass microelectrode.
Figure 3
Figure 3
Experimental transmembrane currents during pacing (depolarization only). (A) Current density (Ic, Im, and Iion) signals during depolarization (wavefront). (B) The current-voltage relationship, Iion versus Vm during depolarization, where Vm = VmVrest normalized to the averaged APA of all animals. The mean and standard errors of all animals are presented as symbols (Vm grouped into 5 mV bins), whereas the individual curves of each animal are shown as solid lines.
Figure 4
Figure 4
Peak values of experimental transmembrane current and charge densities during pacing (depolarization only). Average values and standard errors for all animals (n = 6) for both LP and TP are presented. (A) Current density (Ic, Im, and Iion) during depolarization. The peak inward phase of Im was statistically different than the peak outward phase, as indicated by asterisks for both LP and TP. (B) Charge density (Qc, Qm, and Qion) during depolarization.
Figure 5
Figure 5
Novel, to our knowledge, current-voltage relationship and corresponding simulation results (repolarization). (A) Iion during repolarization for all six animals (gray symbols) with our novel characterization (i.e., Eq. 7) superimposed as a thick black line. (B) Vm for all six animals (thin gray lines) with a simulated action potential during propagation using our empirical characterization of Iion (see Eq. 6–8) superimposed as a thick black line.
Figure 6
Figure 6
Simulations of propagation using our novel, to our knowledge, current-voltage relationships and correspondence to experimental data (depolarization only). The time course of the action potential upstroke (A) Im (B), and Iion (C) for our numerical simulations (thin black lines) using the experimentally derived Iion(V) relationship presented in Eq. 6 along with experimental data for LP (symbols represent average and standard error of all six hearts). All data have been aligned to the time of Icmax indicated by a vertical dashed line.
Figure 7
Figure 7
Transmembrane currents during experimental VF. (Top) One second recording of Vi from a microelectrode on the surface of the rabbit heart during VF. (Middle) Transmembrane currents during depolarization corresponding to these two beats. (Bottom) Isochrone maps of two beats (2 ms spacing).
Figure 8
Figure 8
Peak values of experimental transmembrane current and charge densities during VF (depolarization only). Average values and standard errors for all animals (n = 6) are presented. (A) Current density (Ic, Im, and Iion) during depolarization. The peak inward phase of Im was statistically different than peak outward phase, as indicated by asterisks. (B) Charge density (Qc, Qm, and Qion) during depolarization.

References

    1. Hodgkin A.L., Huxley A.F. A quantitative description of membrane current and its application to conduction and excitation in nerve. J. Physiol. 1952;117:500–544. - PMC - PubMed
    1. Cole K.S., Curtis H.J. Electric impedance of the squid giant axon during activity. J. Gen. Physiol. 1939;22:649–670. - PMC - PubMed
    1. Neher E., Sakmann B. Single-channel currents recorded from membrane of denervated frog muscle fibres. Nature. 1976;260:799–802. - PubMed
    1. Cachelin A.B., de Peyer J.E., Kokubun S., Reuter H. Sodium channels in cultured cardiac cells. J. Physiol. 1983;340:389–401. - PMC - PubMed
    1. Witkowski F.X., Kavanagh K.M., Plonsey R. In vivo estimation of cardiac transmembrane current. Circ. Res. 1993;72:424–439. - PubMed

Publication types