. 2013 Jan 16;13(1):54-66.
doi: 10.1016/j.chom.2012.10.021. Epub 2013 Jan 16.

Efficient retrograde transport of pseudorabies virus within neurons requires local protein synthesis in axons

Affiliations

Efficient retrograde transport of pseudorabies virus within neurons requires local protein synthesis in axons

Orkide O Koyuncu et al. Cell Host Microbe. .

Abstract

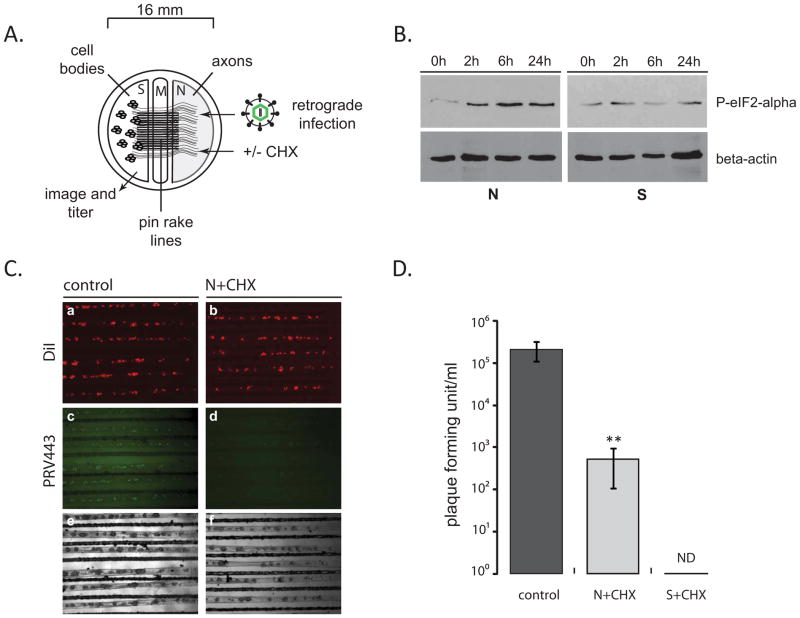
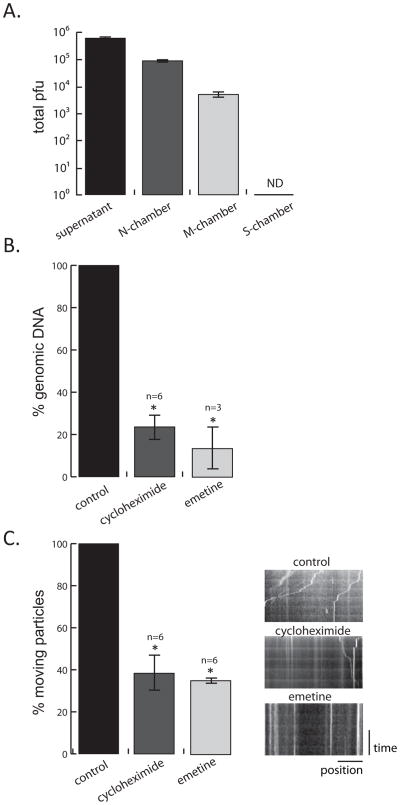
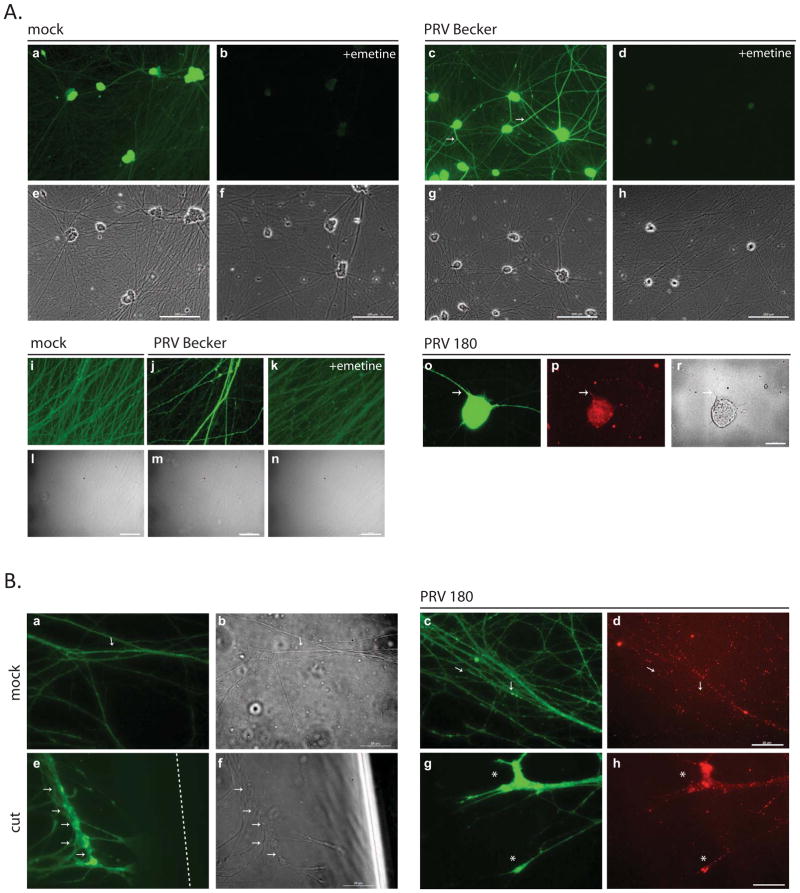
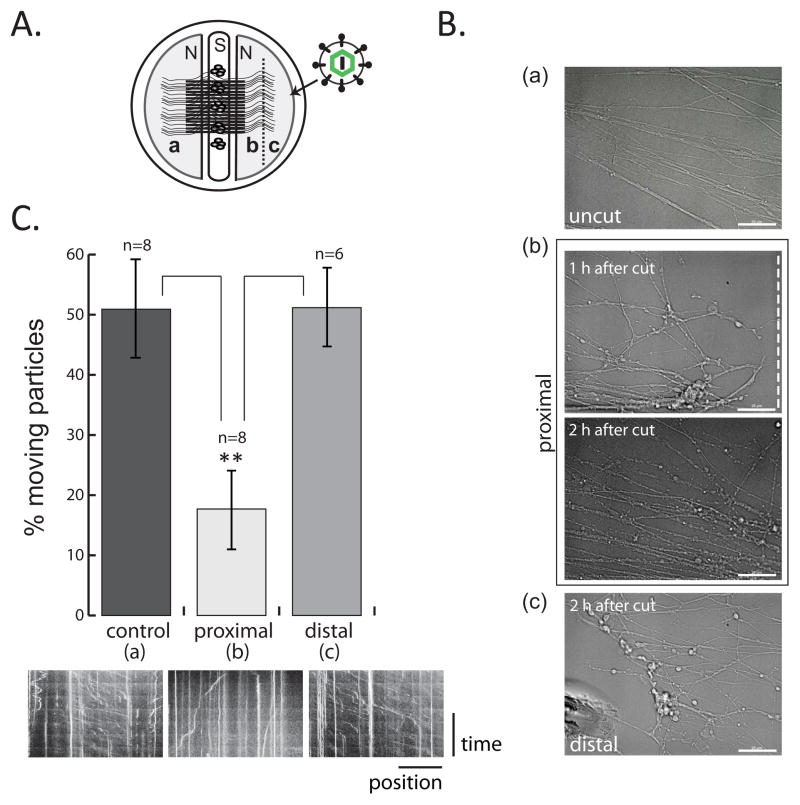
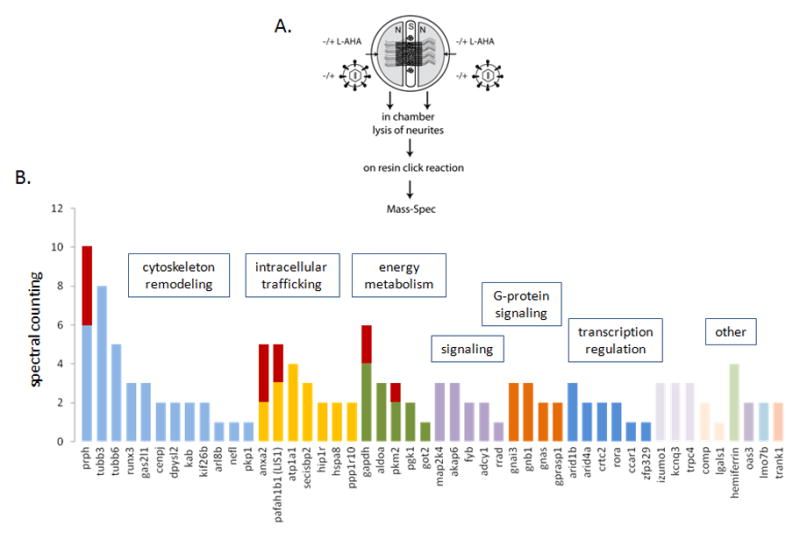
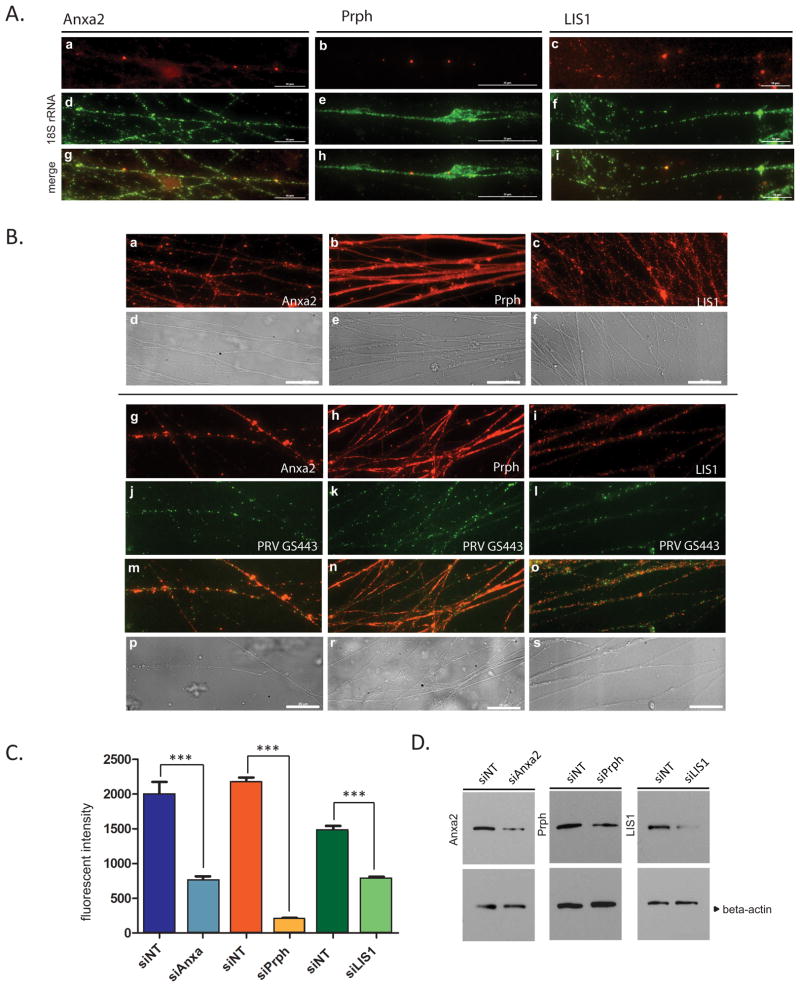
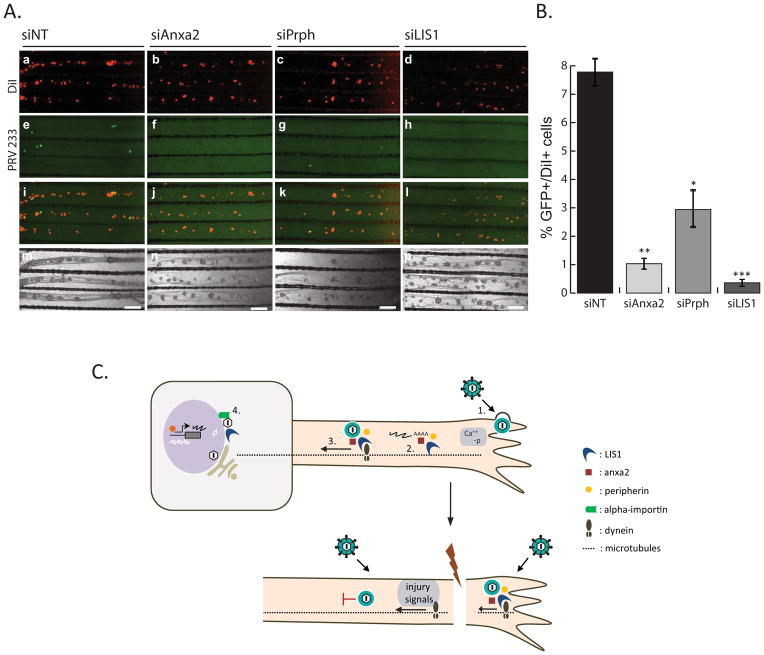
After replicating in epithelial cells, alphaherpesviruses such as pseudorabies virus (PRV) invade axons of peripheral nervous system neurons and undergo retrograde transport toward the distant cell bodies. Although several viral proteins engage molecular motors to facilitate transport, the initial steps and neuronal responses to infection are poorly understood. Using compartmented neuron cultures to physically separate axon infection from cell bodies, we found that PRV infection induces local protein synthesis in axons, including proteins involved in cytoskeletal remodeling, intracellular trafficking, signaling, and metabolism. This rapid translation of axonal mRNAs is required for efficient PRV retrograde transport and infection of cell bodies. Furthermore, induction of axonal damage, which also induces local protein synthesis, prior to infection reduces virion trafficking, suggesting that host damage signals and virus particles compete for retrograde transport. Thus, similar to axonal damage, virus infection induces local protein translation in axons, and viruses likely exploit this response for invasion.


Figures

Figure 1
Figure 1. The effect of axonal protein synthesis inhibition on retrograde PRV infection
(A) Tri-chamber neuron culture is schematically represented (S: soma, M: middle/methocel, N: neurite). (B) Steady state levels of phosphorylated eIF2-alpha after CHX treatment of N-chamber axons. At indicated time points after CHX addition, both S- and N-chambers were lysed in dish and 25 μl of each sample were run on a 12% SDS gel and the membranes were stained with phosphorylated eIF2-alpha and beta-actin antibodies after Western blotting. (C) PRV GS443 retrograde infection in tri-chambers. CHX was added to N-chambers 1 h before infection. Images of S-chambers were taken 20 hpi (4x magnification). (D) S-chamber virus yields were calculated as pfu, 20 hpi in the absence or presence of CHX either in the N-/or S-chambers. Data are the mean ± SEM with**P<0.01 using one sample t-test. ND: not detected, n≥3.
Figure 2
Figure 2. Determining the effect of axonal protein synthesis on retrograde PRV transport (see also figure S1 and movie S1)
(A) PRV Becker inoculum was added to the N-chamber for 2h, followed by the removal of the infection supernatant and the lysis of the axons (M and N-chamber) and cell bodies (S-chamber). Viral DNA in the infection supernatant and all three chambers was quantified by Q-PCR (number of samples=3, ND=not detected). (B) Q-PCR quantification of virus particles in the M-chamber in the absence or presence of CHX and emetine. Inhibitors were added to the N-chamber 1 h before PRV 443 infection. 2 hpi M-chamber axons were lysed in the dish and the amount of viral DNA was determined. (C) Motile and still virus particles in axons in the absence or presence of CHX and emetine were quantified by live-cell imaging. Virus movement was recorded for 2 min. as 1 frame/second. The ratio of moving to total number of capsids was calculated. Minimum 3 different areas in an N-chamber were chosen for each condition (n=number of experiments, see also supplemental figure 1C). Results are normalized to the control condition. Kymographs of the movies were also shown. Vertical lines indicate stationary virus particles whereas diagonal lines indicate motile virus. Data are the mean ± SEM with *P<0.05 using one sample t-test.
Figure 3
Figure 3. Detection of newly synthesized proteins in axons by click chemistry
(A) Dissociated SCG neurons were incubated with 50 μM L-AHA and labeled with alkyne-488 in the absence or presence of emetine. Neurons were either mock infected or infected with Becker or PRV 180. Panels a-d and i-k and o show L-AHA label and e-h, l-n and r show phase contrast images. Panel p shows capsid label (a-h; scale bar is equal to 25 μm, i-r; scale bar is equal to 200 μm). (B) N- chamber axons were incubated and labeled with L-AHA and alkyne-488. Axons were either kept uninfected (a), cut (e) or infected with PRV 180 (b-d, f-h). Panels a, b and e, f show L-AHA label, c and g show capsids, and d and h are the merged images (scale bar is equal to 25 μm). Arrows denote axonal L-AHA labeling, asterix indicate growth cones and the dashed line shows the cut site.
Figure 4
Figure 4. Retrograde PRV infection in injured axons (see also movie S2)
(A) Experimental design is illustrated. Dotted line represents the cut site. (B) Corresponding phase contrast images of uncut (a) and cut (b and c) axons. Axons shown in b are still connected to cell bodies (proximal) whereas axons in c are disconnected (distal). Scale bar is equal to 25 μm.(C) Virus particle movement was recorded in a, b, and c and the results are shown in the graph. Data are the mean ± SEM with **P<0.01 using one sample t-test (n=number of movies). Kymographs are shown for the corresponding sections below the graph. Vertical lines indicate stationary virus particles whereas diagonal lines indicate motile virus.
Figure 5
Figure 5. Identification and classification of newly synthesized proteins in axons after PRV infection (see also figure S2 and table S1)
(A) Experimental design is illustrated. (B) Functional categorization of PRV specific proteins (Metacore, DAVID). The results of 2 independent, summed experiments were shown in the bar graph. Bars indicate the raw spectral counting values for each protein. Red bars denote that the corresponding proteins are identified with high confidence in both experiments. In this case, the spectral counting from each experiment is shown proportionally by two colors.
Figure 6
Figure 6. Localization of identified proteins and their mRNAs in SCG axons (see also figure S3)
(A) Axons in tri-chambers were stained with fluorescent RNA probes for Anxa2 (a), Prph (b) and LIS1 (c), 2 days after siNT transfection in axons. 18S rRNA staining is shown in panels d–f, and merged images are shown in g–i. (B) Mock (a–f) or PRV GS443 infected axons (g–s) were stained with anti-Anxa2 (a and g), anti-Prph (b–h) and anti-LIS1 (c and i) antibodies. Capsid localization (j–l), merged (m–o) and phase-contrast (p–s) images were shown. Scale bar is equal to 25 μm. (B) (C) Dissociated SCG neurons were transfected either with siNT or siRNAs against Anxa2, Prph, and LIS1, and cells were either used for IF staining or Western blotting. After staining with the corresponding antibodies, fluorescent densities were measured (n>10) and shown in the graph (C) and protein bands were shown in (D). Beta-actin was used as loading control. Data are the mean ± SEM with ***P<0.001 using one sample t-test.
Figure 7
Figure 7. The effect of axonal gene knockdown on retrograde PRV infection
(A) Images show representative areas in the S-compartments. N-chambers were transfected with either siNT or gene-specific siRNAs before PRV 233 infection. DiI stained cell bodies (a–d), GFP positive cell bodies (e–h), merged images (i–l), and phase contrast images (m–o) are shown. (B) Graph depicts the percentage of GFP positive to DiI positive cell bodies of either siNT or gene-specific siRNA transfected axons. Data shown are the mean of 3 independent experiments consisting of duplicates. Data are the mean ± SEM with *P<0.05,**P<0.01 and ***P<0.001 using one sample t-test. (C) Hypothesized cascade of events that take place in retrograde PRV infection of healthy and injured axons. 1. Virion attachment and entry, increase in cytosolic calcium and phosphorylation events 2. Translation of axonal mRNAs 3. Formation of dynein coupled transport complexes. 4. Beta-importin dependent nuclear localization and subsequent transcription and replication of viral genomes.

References

    1. Babic N, Mettenleiter TC, Flamand A, Ugolini G. Role of essential glycoproteins gII and gp50 in transneuronal transfer of pseudorabies virus from the hypoglossal nerves of mice. J Virol. 1993;67:4421–4426. - PMC - PubMed
    1. Brittle EE, Reynolds AE, Enquist LW. Two modes of pseudorabies virus neuroinvasion and lethality in mice. J Virol. 2004;78:12951–12963. - PMC - PubMed
    1. Ch’ng TH, Enquist LW. Neuron-to-cell spread of pseudorabies virus in a compartmented neuronal culture system. J Virol. 2005;79:10875–10889. - PMC - PubMed
    1. Chang L, Shav-Tal Y, Trcek T, Singer RH, Goldman RD. Assembling an intermediate filament network by dynamic cotranslation. J Cell Biol. 2006;172:747–758. - PMC - PubMed
    1. Cheshenko N, Del Rosario B, Woda C, Marcellino D, Satlin LM, Herold BC. Herpes simplex virus triggers activation of calcium-signaling pathways. J Cell Biol. 2003;163:283–293. - PMC - PubMed

Publication types

MeSH terms

LinkOut - more resources