

Changes in the frequency of family meals from 1999 to 2010 in the homes of adolescents: trends by sociodemographic characteristics
- PMID: 23332485
- PMCID: PMC3552297
- DOI: 10.1016/j.jadohealth.2012.06.004
Changes in the frequency of family meals from 1999 to 2010 in the homes of adolescents: trends by sociodemographic characteristics
Abstract
Objective: To examine secular trends from 1999 to 2010 in family meal frequency in a population-based sample of adolescents across sociodemographic characteristics.
Methods: A repeated cross-sectional design was used. Participants were from middle schools and high schools in the Minneapolis/St. Paul area and included 3,072 adolescents (mean age = 14.6 ± 1.8 years) in 1999 and 2,793 adolescents (mean age = 14.4 ± 2.0 years) in 2010 from diverse ethnic/racial and socioeconomic backgrounds. Trends in family meal frequency were examined using inverse probability weighting to control for changes in sociodemographic characteristics over time.
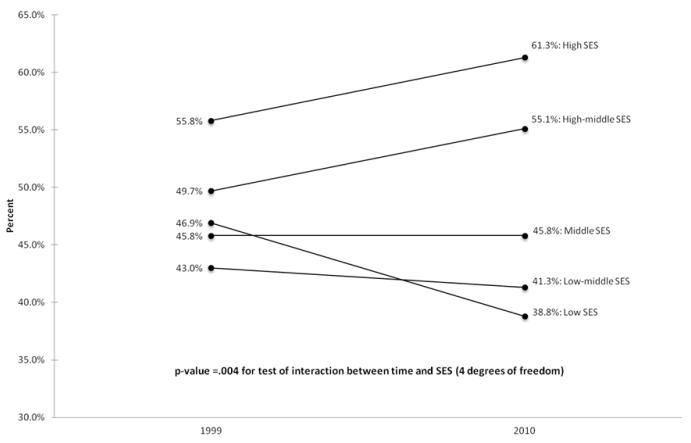
Results: Family meal frequency remained fairly constant from 1999 to 2010 in the overall sample, but decreases were found in population subgroups including girls, middle school students (grade: 6-8), Asians, and youth from low socioeconomic backgrounds. Among youth from the lowest socioeconomic backgrounds, the mean number of family meals in the past week decreased from 4.0 in 1999 to 3.6 in 2010 (p = .003). Furthermore, the percentage of youth from low socioeconomic backgrounds eating five or more meals in the past week decreased from 46.9% in 1999 to 38.8% in 2010 (p < .001). In contrast, family meal frequency tended to increase over time among youth from higher socioeconomic backgrounds.
Conclusions: The widening gap in family meal frequency between youth from low and high socioeconomic backgrounds is concerning, particularly given the greater risk for poor health outcomes among low-income youth. Given findings from other studies suggesting multiple benefits of family meals, interventions to increase family meal frequency are needed that target adolescents and their families from the most vulnerable segments of the population.
Copyright © 2013 Society for Adolescent Health and Medicine. Published by Elsevier Inc. All rights reserved.
Figures
References
-
- Neumark-Sztainer D, Hannan PJ, Story M, et al. Family meal patterns: Associations with sociodemographic characteristics and improved dietary intake among adolescents. J Am Diet Assoc. 2003;103(3):317–322. - PubMed
-
- Gillman MW, Rifas-Shiman SL, Frazier AL, et al. Family dinner and diet quality among older children and adolescents. Arch Fam Med. 2000;9(3):235–240. - PubMed
-
- Videon TM, Manning CK. Influences on adolescent eating patterns: The importance of family meals. J Adolesc Health. 2003;32:365–373. - PubMed
-
- Woodruff SJ, Hanning RM, McGoldrick K, et al. Healthy eating index-C is positively associated with family dinner frequency among students in grades 6-8 from Southern Ontario, Canada. Eur J Clin Nutr. 2010;64(5):454–460. - PubMed
-
- MacFarlane A, Crawford D, Ball K, et al. Adolescent home food environments and socioeconomic position. Asia Pac J Clin Nutr. 2007;16(4):748–756. - PubMed
Publication types
MeSH terms
Grants and funding
LinkOut - more resources
Full Text Sources
Other Literature Sources
Medical
Miscellaneous
