. 2013 Jan 17;152(1-2):340-51.
doi: 10.1016/j.cell.2012.12.010.

Monitoring tumorigenesis and senescence in vivo with a p16(INK4a)-luciferase model

Affiliations

Monitoring tumorigenesis and senescence in vivo with a p16(INK4a)-luciferase model

Christin E Burd et al. Cell. .

Abstract

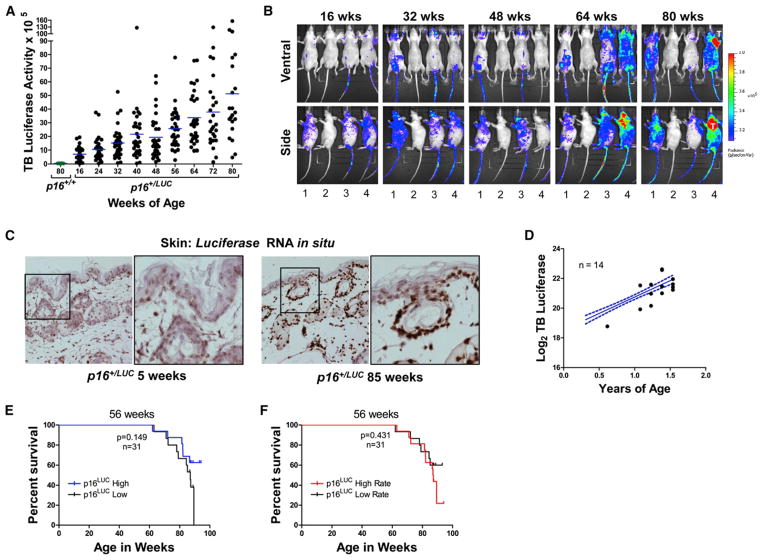
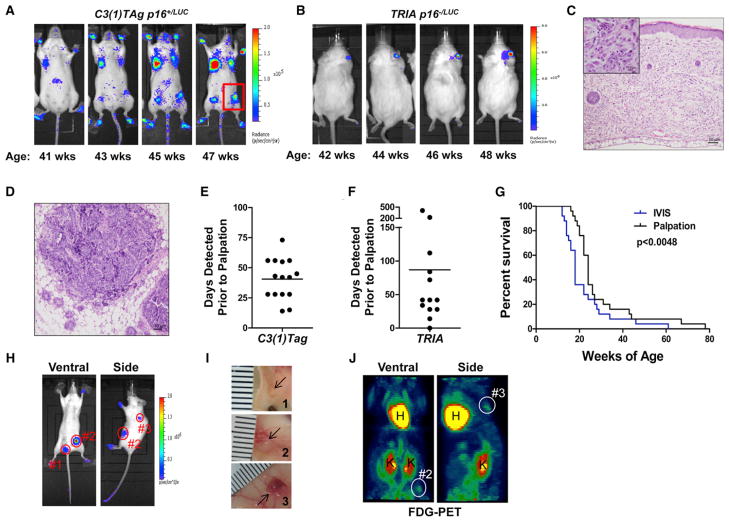
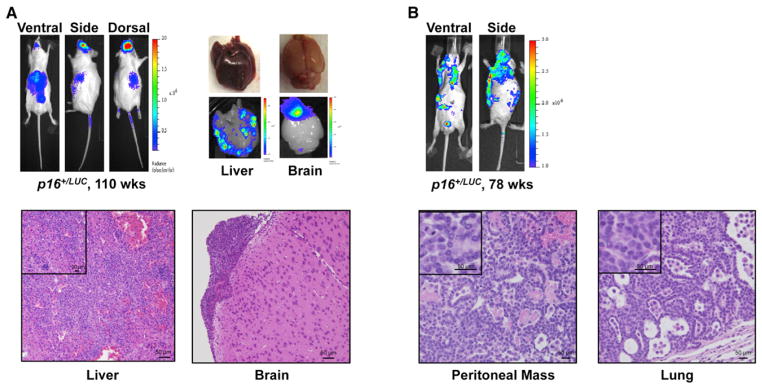
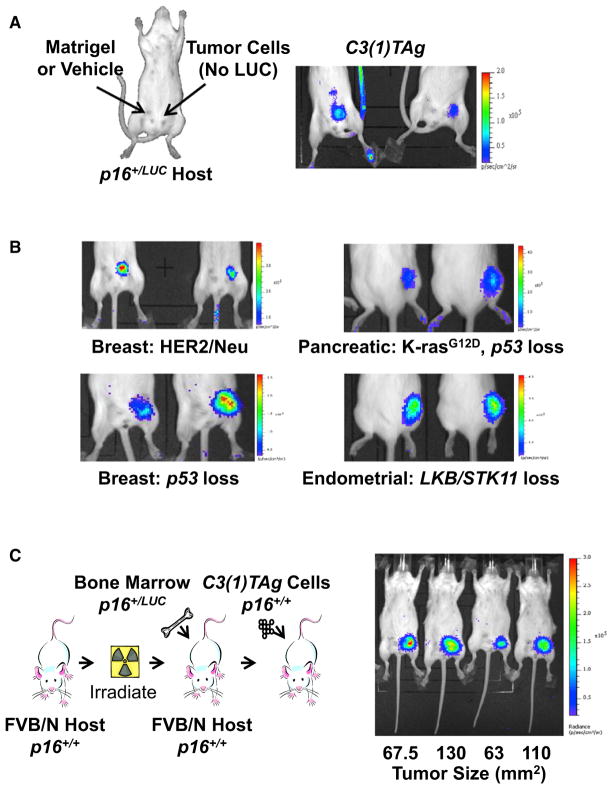
Monitoring cancer and aging in vivo remains experimentally challenging. Here, we describe a luciferase knockin mouse (p16(LUC)), which faithfully reports expression of p16(INK4a), a tumor suppressor and aging biomarker. Lifelong assessment of luminescence in p16(+/LUC) mice revealed an exponential increase with aging, which was highly variable in a cohort of contemporaneously housed, syngeneic mice. Expression of p16(INK4a) with aging did not predict cancer development, suggesting that the accumulation of senescent cells is not a principal determinant of cancer-related death. In 14 of 14 tested tumor models, expression of p16(LUC) was focally activated by early neoplastic events, enabling visualization of tumors with sensitivity exceeding other imaging modalities. Activation of p16(INK4a) was noted in the emerging neoplasm and surrounding stromal cells. This work suggests that p16(INK4a) activation is a characteristic of all emerging cancers, making the p16(LUC) allele a sensitive, unbiased reporter of neoplastic transformation.


Figures

Figure 1
Figure 1. Design and Validation of the p16LUC Allele
(A) Schematic of the p16LUC knockin targeting strategy. “+ Flp” denotes the targeted allele after Flp-recombinase-mediated excision of the neomycin selection cassette. (B) Induction of p16INK4a mRNA is shown in MEFs of indicated genotypes passaged on a 3T3 schedule. Fold induction was calculated with respect to p16INK4a transcript levels at day 3. Data shown correspond to three biological replicates performed in triplicate. Error bars represent SEM. (C) p19ARF and p16INK4a western blots for littermate MEFs cultured on a 3T3 schedule and harvested at the indicated time points. (D) Fold p16INK4a induction is shown for the western blots represented in (C). Bands were quantified by using a LICOR Odyssey system, normalized to total protein, and analyzed as in (B). (E) Luciferase activity in MEFs of the indicated genotypes, with results calculated and presented as in (B). Error bars are ±SEM. (F) Correlation of luciferase activity and endogenous p16INK4a expression in p16+/LUC MEFs passaged on a 3T3 schedule. Data represent ≥3 biological replicates at multiple in vitro time points with best-fit line and 95% confidence intervals (dashed lines) shown. Linear regression was used to calculate the p value and correlation coefficient (r). (G) Representative, 2 min luminescent images of a lactating p16+/LUC mouse at the indicated time points relative to the weaning date (WD). (H) Representative, 2 min photographic and luminescent images of a p16+/LUC mouse with healing wounds. See Figure S1 for additional related data.
Figure 2
Figure 2. Induction of p16LUC Correlates with Age, but Not with Life Span
(A) Total body luciferase activity in hairless (SKH1-E) p16+/LUC mice quantified using a 2 min, ventral image and plotted versus age (n = 32). The blue line represents the median value for each time point. Luciferase activity in 80-week-old p16+/+ mice is shown for comparison. For statistical analyses, at each time point, the ratio of total body luminescence relative to week 16 was calculated. Wilcoxon signed-rank tests were used to test whether each ratio was significantly different than 1. p < 0.0001 for all comparisons except week 24 (p = 0.018). (B) Representative serial luciferase images of mice from the study shown in (A). Each 2 min image shows the same group of mice, arranged identically. Mouse 2 is p16+/+, whereas all other mice are p16+/LUC. (C) Skin from the hind quarter of old and young p16+/LUC animals was fixed in the same paraffin block and subjected to single-molecule luciferase RNA in situ hybridization. Shown are representative images of tissues from the same paraffin block with luciferase message appearing as brown dots. Original magnification = 40×. (D) The average total body luciferase activity for the cohort shown in (A) is plotted in blue with 95% confidence intervals depicted by dotted lines. Plotted in black are points representing total body luciferase activity in the image preceding the life span event (death of tumor formation) for each mouse (n = 14). (E) Total body luciferase activity was calculated for each living mouse at 56 weeks of age. Using the median luciferase activity at this time point, mice were divided into high and low groups. Kaplan Meier curves for each group are shown with p values calculated by using a log rank test. (F) By using linear regression, the rate of luciferase increase was calculated for each mouse alive at 56 weeks. By using the median rate of increase at this time point, mice were divided into high and low groups. Kaplan Meier curves for each group are shown, and p values were calculated by using a log rank test. See Figure S2 for additional related data.
Figure 3
Figure 3. p16LUC Marks Early, De Novo Tumorigenesis
(A) Representative serial images showing p16LUC accumulation at p16+/LUC, C3(1)TAg+ tumor foci during a period of 8 weeks. Several focal, mammary, and paw tumors are visible. A palpable tumor, smaller than could be measured by calipers, is highlighted in the red box. (B) Representative serial images showing p16LUC accumulation at a p16−/LUC TRIA ear tumor during a period of 6 weeks. (C) Haematoxylin and eosin staining showing the morphology of the TRIA ear tumor shown in (B). (D) Haematoxylin and eosin staining showing the morphology of the barely palpable C3(1)TAg tumor highlighted in (A). (E) The number of days prior to palpation or visualization where luciferase activity was observed in tumors of p16+/LUC C3(1)TAg mice. Data are shown for individual tumors with the median detection advantage indicated by a line. (F) The number of days prior to palpation or visualization where luciferase activity was observed in tumors from p16−/LUC TRIA mice. Data are depicted as in (E). (G) Combined Kaplan-Meier analysis of tumor-free survival in p16+/LUC C3(1)TAg and p16−/LUC TRIA mice by using tumor detection by either luminescence or palpation. Significance was determined by using a log rank test. (H) Luciferase images of a p16+/LUC C3(1)TAg mouse with early mammary tumors (2 min ventral image, 1 min side image). (I) Photographic images of mammary tumors dissected from the mouse in (H) and (J). Ruler hash marks represent 1 mm units. (J) FDG-PET images of the same p16+/LUC C3(1)TAg mouse shown in (H). Tumor 1 is not visualized by FDG-PET. See additional supporting data in Figure S3.
Figure 4
Figure 4. p16LUC Activity Detects Spontaneous Cancers In Vivo
(A) (Top) Detection of a spontaneous histiocytic malignancy in a 110-week-old p16+/LUC mouse. All luminescent images shown were 1 min in length except the ventral image, which was 2 min long. Organ images were taken immediately following imaging. (Bottom) Haematoxylin and eosin stained fixed tissues confirm the presence of malignancy within luciferase positive regions of the brain and liver. (B) (Top) Luminescent detection of a spontaneous, disseminated lung adenocarcinoma in a 78-week-old p16+/LUC mouse. Images were generated as in (A) with confirmatory histology shown below. See also Figure S4 and Table S1.
Figure 5
Figure 5. p16LUC Activity Signals Cancer via Non-Cell-Autonomous Mechanisms
(A) Immune competent, FVB/N p16+/LUC mice were injected orthotopically as depicted with syngeneic p16+/+ C3(1)TAg cells in matrigel or matrigel vehicle alone and imaged upon tumor establishment. A representative 2 min image is shown. (B) Syngeneic p16+/+ breast (MMTV-HER2/Neu and K14-CRE p53Lox/Lox), pancreatic (Pdx-CRE LSL-K-rasG12D p53Lox/Lox), and endometrial (Sprr2f-CRE Lkb1Lox/Lox) cancer cell lines were injected subcutaneously into p16+/LUC mice and imaged upon tumor establishment. Representative 2 min luminescent images are shown for each model. (C) Syngeneic transplantations of p16+/LUC bone marrow into p16+/+ recipients were conducted as depicted. Following immune reconstitution, syngeneic p16+/+ C3(1)TAg cells were orthotopically transplanted into the mice and imaged as in (A). Tumor size at the time of imaging is noted. Robust luciferase activity was seen in all transplanted tumors, but not in contralateral sites injected with matrigel only. See also Figure S5.

Comment in

  • Senescence: Improved detection.
    Seton-Rogers S. Seton-Rogers S. Nat Rev Cancer. 2013 Mar;13(3):150. doi: 10.1038/nrc3473. Epub 2013 Feb 14. Nat Rev Cancer. 2013. PMID: 23407578 No abstract available.
  • Cancer cells report.
    Nawy T. Nawy T. Nat Methods. 2013 Mar;10(3):195. doi: 10.1038/nmeth.2393. Nat Methods. 2013. PMID: 23570043 No abstract available.

References

    1. Austad SN. Comparative aging and life histories in mammals. Exp Gerontol. 1997;32:23–38. - PubMed
    1. Baker DJ, Perez-Terzic C, Jin F, Pitel KS, Niederländer NJ, Jeganathan K, Yamada S, Reyes S, Rowe L, Hiddinga HJ, et al. Opposing roles for p16Ink4a and p19Arf in senescence and ageing caused by BubR1 insufficiency. Nat Cell Biol. 2008;10:825–836. - PMC - PubMed
    1. Baker DJ, Wijshake T, Tchkonia T, LeBrasseur NK, Childs BG, van de Sluis B, Kirkland JL, van Deursen JM. Clearance of p16Ink4a-positive senescent cells delays ageing-associated disorders. Nature. 2011;479:232–236. - PMC - PubMed
    1. Bardeesy N, Aguirre AJ, Chu GC, Cheng KH, Lopez LV, Hezel AF, Feng B, Brennan C, Weissleder R, Mahmood U, et al. Both p16(Ink4a) and the p19(Arf)-p53 pathway constrain progression of pancreatic adenocarcinoma in the mouse. Proc Natl Acad Sci USA. 2006;103:5947–5952. - PMC - PubMed
    1. Bartkova J, Rezaei N, Liontos M, Karakaidos P, Kletsas D, Issaeva N, Vassiliou LV, Kolettas E, Niforou K, Zoumpourlis VC, et al. Oncogene-induced senescence is part of the tumorigenesis barrier imposed by DNA damage checkpoints. Nature. 2006;444:633–637. - PubMed

Publication types