. 2013 Feb 21;38(2):275-84.
doi: 10.1016/j.immuni.2012.09.023. Epub 2013 Jan 17.

Amphiregulin enhances regulatory T cell-suppressive function via the epidermal growth factor receptor

Affiliations

Amphiregulin enhances regulatory T cell-suppressive function via the epidermal growth factor receptor

Dietmar M W Zaiss et al. Immunity. .

Abstract

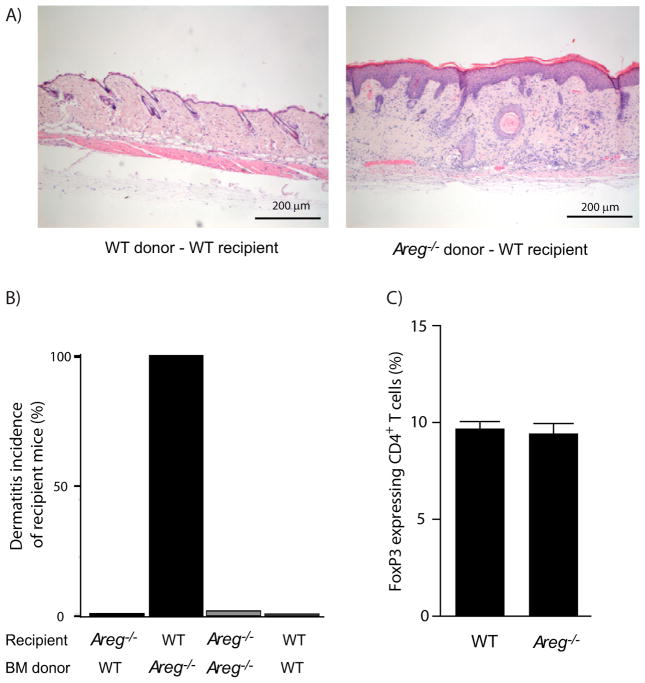
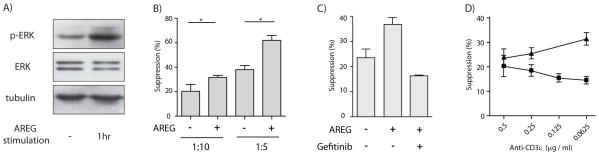
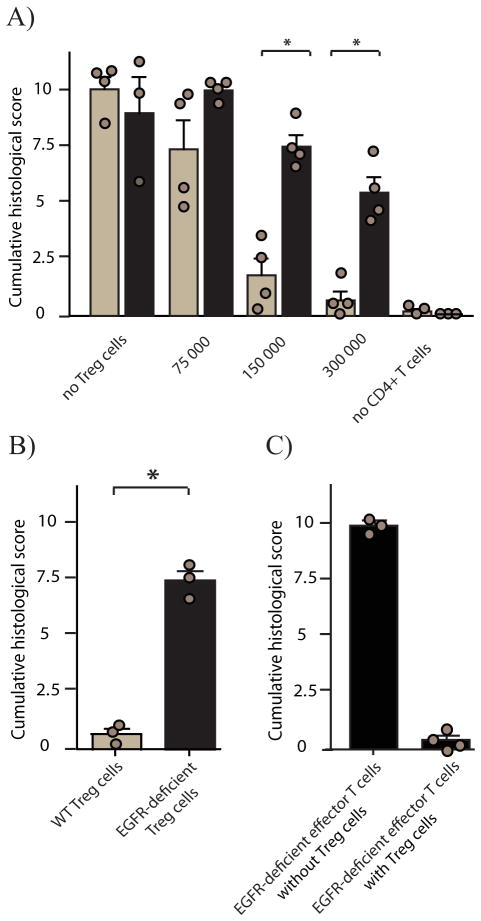
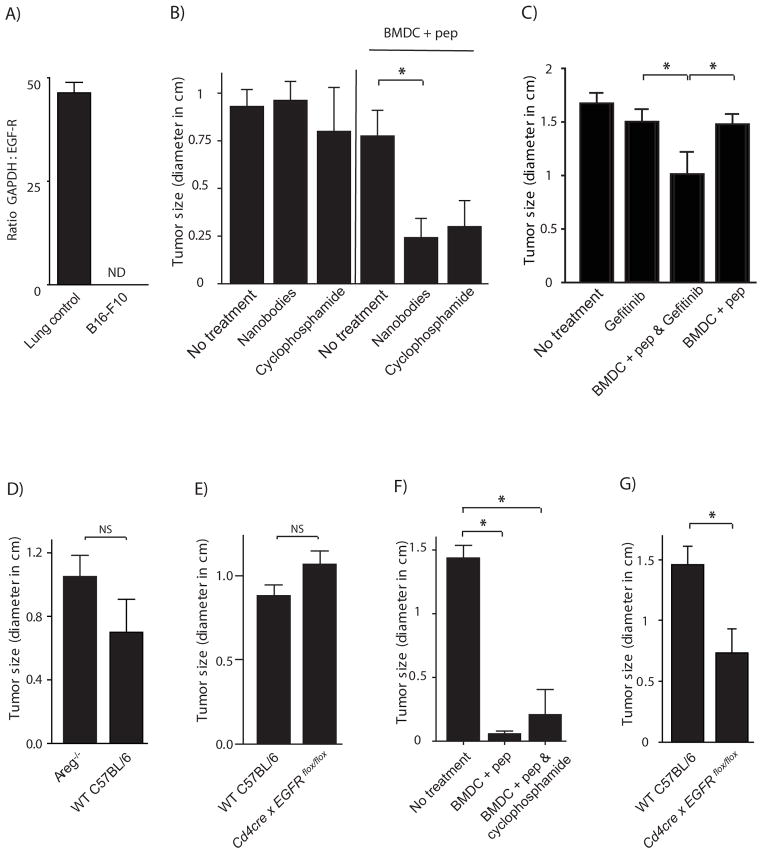
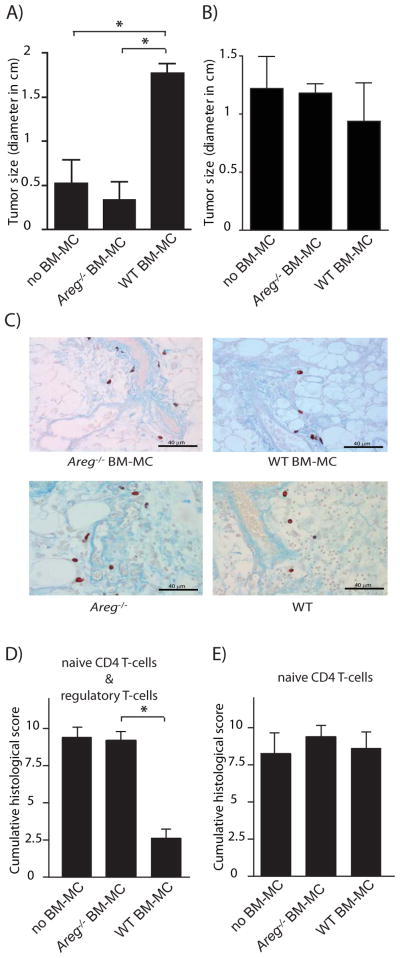
Epidermal growth factor receptor (EGFR) is known to be critically involved in tissue development and homeostasis as well as in the pathogenesis of cancer. Here we showed that Foxp3(+) regulatory T (Treg) cells express EGFR under inflammatory conditions. Stimulation with the EGF-like growth factor Amphiregulin (AREG) markedly enhanced Treg cell function in vitro, and in a colitis and tumor vaccination model we showed that AREG was critical for efficient Treg cell function in vivo. In addition, mast cell-derived AREG fully restored optimal Treg cell function. These findings reveal EGFR as a component in the regulation of local immune responses and establish a link between mast cells and Treg cells. Targeting of this immune regulatory mechanism may contribute to the therapeutic successes of EGFR-targeting treatments in cancer patients.


Figures

Figure 1
Figure 1. BM chimeric WT mice reconstituted with Areg−/− BM develop dermatitis
A & B) BL6-SJL (CD45.1) or Areg−/− mice were irradiated with 10 Gy X-rays and reconstituted with 107 BM cells derived from BL6-SJL or Areg−/− mice, incidence of dermatitis of recipient mice six weeks after BM transfer is shown (n= 4 mice per group, bars represent means +SEM). C) Lymphocytes derived from mesenteric lymph nodes of WT or Areg−/− mice were stained for CD4 and intracellular for FoxP3; frequency of FoxP3 expressing cells is shown (n=4 mice per group, bars represent means +SEM). For additional information, see Figure S1.
Figure 2
Figure 2. Treg cells express EGFR
A & B) T cells from the blood of healthy volunteers were sorted by flow cytometry based on CD4 and CD8 expression. Effector T cells and Treg cells were further separated based on non-overlapping expression markers, i.e. CD127hi versus CD127lo and CD25lo versus CD25hi, respectively. EGFR expression was determined by quantitative RT-PCR. A) Depicts absolute expression in comparison to β2m expression and B) depicts relative EGFR expression of different T cell populations to each other. (n=3 volunteers per group, bars represent means +SEM). ND = non detectible (no signal for EGFR) C) Treg cells derived from the spleen of FoxP3-GFP mice were sorted by flow cytometry based on GFP expression. EGFR mRNA expression was determined by quantitative RT-PCR (Experiment performed in triplicates, bar represents means +/− SEM). D) PBMC of healthy volunteers were blocked with an excess of unspecific nanobodies and then stained for CD4, EGFR using an EGFR-specific biotinylated nanobody. Thereafter, cells were stained intracellularly for Helios and FoxP3 and SA-PE. Black line shows EGFR staining; filled line represents background SA-PE only staining. E) EGFR expression on tumor infiltrating Treg cells derived from B16 melanoma of WT C57BL/6 or Egfrflox/flox × Cd4cre mice was analyzed by flow-cytometry. Cells were stained for CD4, EGFR and intracellular for FoxP3. Full lines show the staining of Treg cells derived from WT mice, filled lines the staining of Treg cells derived from Egfrflox/flox × Cd4cre mice. For additional information, see Figure S2.
Figure 3
Figure 3. Amphiregulin enhances the suppressive capacity of EGFR expressing Treg cells in vitro
A) iTregs were differentiated form umbilical cord blood CD4+ T cells in the presence of TGF-β. After 5 days of differentiation, 0.5×10⁷ were either treated with 100 ng/ml AREG or left untreated and ERK activation determined by protein blot with p-ERK specific antiserum. B) PBMCs derived from healthy volunteers were stimulated with membrane-bound anti-CD3 and CD25+CD127 CD4+ Treg cells were added to suppress proliferation of CFSE-labeled CD4+ T cells, in the presence or absence of at least 100 ng/ml recombinant AREG and (C) in the presence or absence of 100 ng/ml Gefitinib. Proliferation was defined as the percentage of cells that had undergone at least one division. (Experiment performed in triplicates; bars represent means +SEM). D) Mouse FoxP3-GFP CD4+ T cells were cultured for four days together with CFSE labeled CD45.1 expressing splenocytes at a ratio of 1:4 in the presence or absence of 100 ng/ml rec. AREG. T cells were activated with different amounts of soluble anti-CD3, and CFSE dilution within the CD45.1 expressing CD8+ T cell population was analyzed by flow-cytometry. Proliferation was defined as the percentage of cells that had undergone at least one division. Triangles, inhibition in the presence of AREG; squares, inhibition in the absence of AREG. (Experiments performed in triplicates; points are means +/−SEM) For additional information, see Figure S3.
Figure 4
Figure 4. Amphiregulin enhances Treg cell function in vivo
Rag1−/− (light bars) or Areg−/−Rag1−/− (dark bars) mice received 400 000 flow cytometry-sorted naive CD4+ T cells together with (A) increasing numbers of FoxP-GFP expressing Treg cells or (B) Rag1−/− mice received 400 000 naive CD4+ T cells together with 200 000 CD25+ CD4+ T cells derived from either WT (light bar) or Egfrflox/flox × Cd4-cre (dark bar) mice or C) Rag1−/− mice received 400 000 naive CD4+ T cells derived from Egfrflox/flox 0215 Cd4-cre mice in the presence or absence of 200 000 CD25+ CD4+ T cells derived from WT mice. Development of colitis was measured six weeks later by histological score. Bars represent means +SEM; results for individual mice are shown as circles. For additional information and representative H&E staining of tissue samples derived from the different mouse groups, see Figure S4.
Figure 5
Figure 5. AREG is of critical importance for the efficient suppression of anti-tumor immune responses
A) mRNA from B16-F10 tumor cells and control lung tissue was purified and quantitative RT-PCR was performed. Bar is mean of ratio GAPDH : EGFR expression +SEM. ND = non-detectable (no signal for EGFR). B – C) 1×10⁴ B16-F10 cells were injected s.c. into the left flank of WT C57BL/6. On day 5 and 7 after tumor cell transfer, mice were immunized with BM-DC loaded with an immunogenic B16 melanoma epitope (TRP2180–188) or left un-immunized. One mouse group received in addition 300 μg purified EGFR blocking nanobodies (B), or 200 μg Gefitinib (C), every other day for one week starting from day 5. D–G) 1×10⁴ B16-F10 cells were injected s.c. into WT C57BL/6 or AREG−/− (D & F) mice or Egfrflox/flox × Cd4-cre mice (E & G). On day 5 and 7 after tumor cell transfer, mice were immunized with BM-DC loaded with an immunogenic B16 melanoma epitope (TRP2180–188) (F & G) or left un-immunized (D & E). Tumor size was determined on days 21 till 23 after tumor transfer. (n = 3 – 7 mice per group; bars represent mean +SEM)
Figure 6
Figure 6. Mast cell-derived AREG enhances Treg function in vivo
A&B) 1×10⁴ B16-F10 cells were injected s.c. into c-kitw-sh/w-sh mice reconstituted with BM-MC differentiated from BM derived from WT C57BL/6 or Areg−/− mice, or were left un-reconstituted. On day 5 and 7 after tumor cell transfer, mice were immunized with BM-DC loaded with an immunogenic B16 melanoma epitope (TRP2180–188) (A) or left un-immunized (B). Tumor size was determined 23 days after tumor transfer. n = 5–7 mice per group. Bars represent means +SEM. C) c-kitw-sh/w-sh mice were reconstituted with either WT or Areg−/− BM-MC. Three weeks after re-constitution 10 000 B16-F10 cells were injected. 21 days after tumor cell transfer, tumors were harvested and stained for mast cells using Csaba staining. D&E) c-kitw-sh/w-shRag1−/− mice were reconstituted with BM-MC derived from either WT C57BL/6 or Areg−/− mice, or were left un-reconstituted. 200 000 FoxP3/GFP CD4+ T cells were co-transferred with 400 000 naive CD4+ T cells and colitis scores were determined six weeks after transfer. (n = 3–7 mice per group. Bars represent means +SEM). For additional information, see Figure S6.

References

    1. Altan-Bonnet G, Germain RN. Modeling T cell antigen discrimination based on feedback control of digital ERK responses. PLoS Biol. 2005;3:e356. - PMC - PubMed
    1. Amini RM, Aaltonen K, Nevanlinna H, Carvalho R, Salonen L, Heikkila P, Blomqvist C. Mast cells and eosinophils in invasive breast carcinoma. BMC Cancer. 2007;7:165. - PMC - PubMed
    1. Apetoh L, Ghiringhelli F, Tesniere A, Obeid M, Ortiz C, Criollo A, Mignot G, Maiuri MC, Ullrich E, Saulnier P, et al. Toll-like receptor 4-dependent contribution of the immune system to anticancer chemotherapy and radiotherapy. Nat Med. 2007;13:1050–1059. - PubMed
    1. Avraham R, Yarden Y. Feedback regulation of EGFR signalling: decision making by early and delayed loops. Nat Rev Mol Cell Biol. 2011;12:104–117. - PubMed
    1. Berg DJ, Davidson N, Kuhn R, Muller W, Menon S, Holland G, Thompson-Snipes L, Leach MW, Rennick D. Enterocolitis and colon cancer in interleukin-10-deficient mice are associated with aberrant cytokine production and CD4(+) TH1-like responses. J Clin Invest. 1996;98:1010–1020. - PMC - PubMed

Publication types

MeSH terms