. 2013 Feb 21;38(2):296-308.
doi: 10.1016/j.immuni.2012.10.015. Epub 2013 Jan 17.

Angiotensin II drives the production of tumor-promoting macrophages

Affiliations

Angiotensin II drives the production of tumor-promoting macrophages

Virna Cortez-Retamozo et al. Immunity. .

Abstract

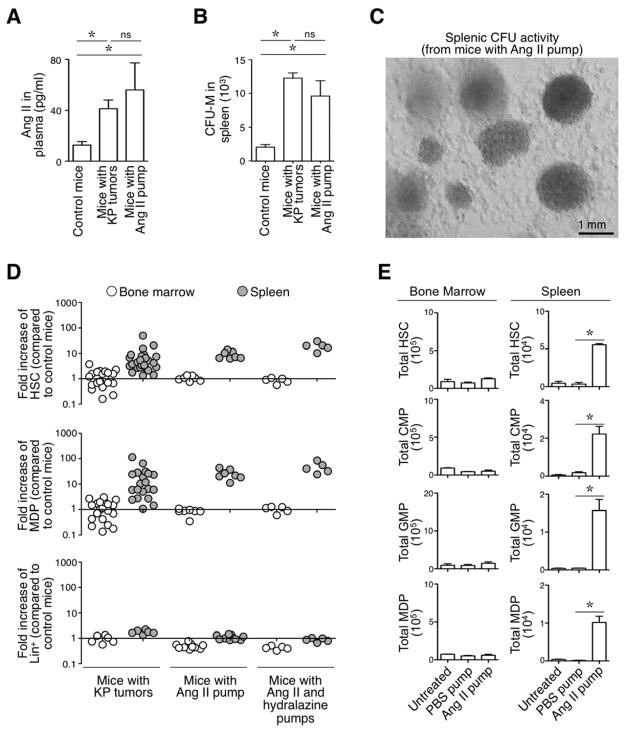
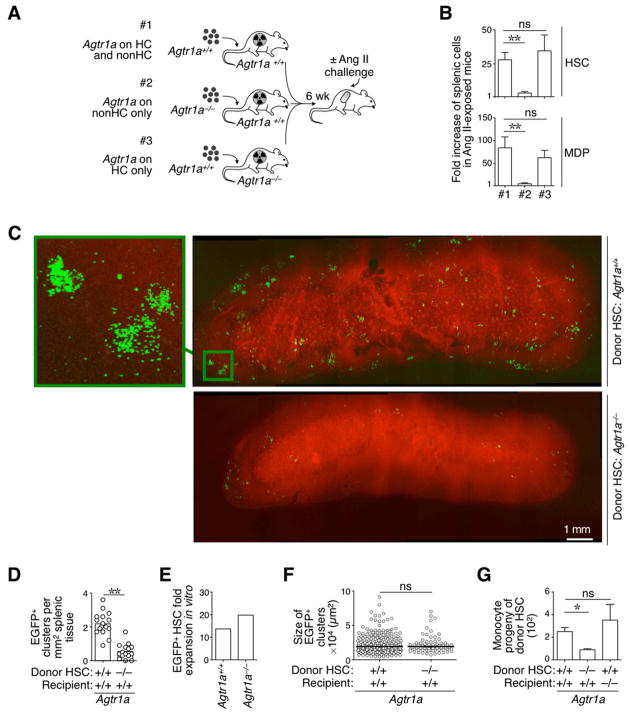
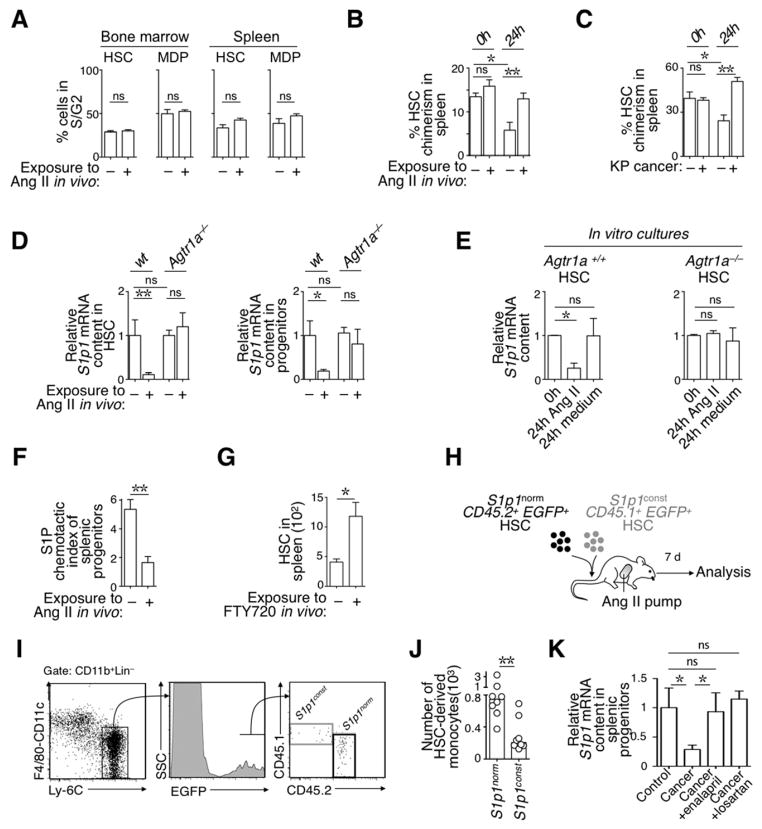
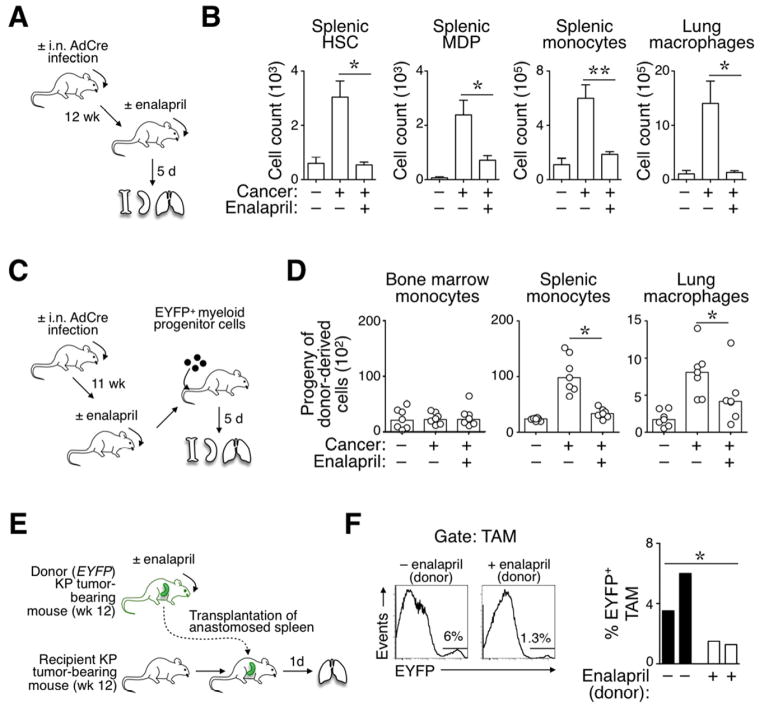
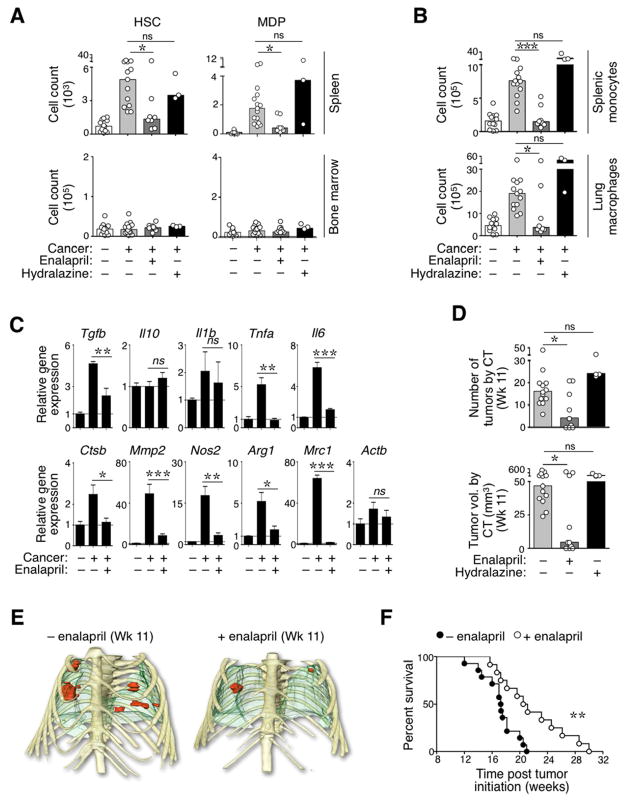
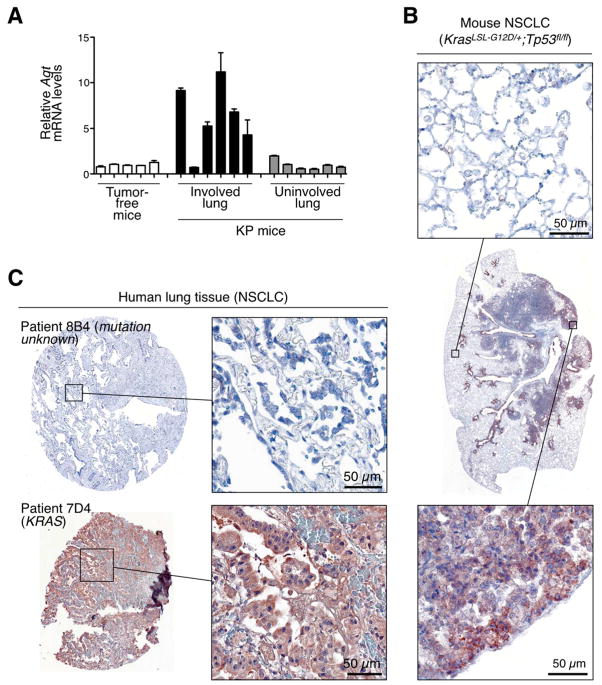
Macrophages frequently infiltrate tumors and can enhance cancer growth, yet the origins of the macrophage response are not well understood. Here we address molecular mechanisms of macrophage production in a conditional mouse model of lung adenocarcinoma. We report that overproduction of the peptide hormone Angiotensin II (AngII) in tumor-bearing mice amplifies self-renewing hematopoietic stem cells (HSCs) and macrophage progenitors. The process occurred in the spleen but not the bone marrow, and was independent of hemodynamic changes. The effects of AngII required direct hormone ligation on HSCs, depended on S1P(1) signaling, and allowed the extramedullary tissue to supply new tumor-associated macrophages throughout cancer progression. Conversely, blocking AngII production prevented cancer-induced HSC and macrophage progenitor amplification and thus restrained the macrophage response at its source. These findings indicate that AngII acts upstream of a potent macrophage amplification program and that tumors can remotely exploit the hormone's pathway to stimulate cancer-promoting immunity.


Figures

Figure 1
Figure 1. (See also Figure S1). AngII amplifies HSC and macrophage progenitors in the spleen regardless of hemodynamics
A. AngII concentration in plasma (measured by ELISA) from control mice (n=9), mice with KP tumors at 11–12 wk post tumor initiation (n=12) and mice infused with AngII via an osmotic mini-pump (n= 6). B. Number of colony-forming units (CFUs) obtained with total splenocytes from control mice (n=3), mice with KP tumors (n=3) and mice infused with AngII (n=4). C. Representative photograph of CFUs obtained with splenocytes from a mouse infused with AngII. Scale bar represents 1 mm. D. Fold increase in the number of HSCs (top), MDPs (middle) and Lin+ cells (down) in bone marrow (white circles) and spleen (gray circles) of KP mice (n=27), mice with AngII pump (n=6) and mice with AngII and hydralazine pumps (n=5), when compared to untreated control mice (average from n=5–12). (Lin defined as [B220/CD19/CD90.2/DX5/NK1.1/Ly-6G]). E. Quantification of HSCs, CMPs, GMPs and MDPs in the bone marrow (left) and spleen (right) of mice that were left untreated (Control, n=5), that received a mini-pump delivering PBS for 8 d (PBS pump, n= 5) and that received a mini-pump delivering AngII for 8 d (AngII pump, n=5). Data in A, B and E are presented as mean ± SEM. Data in E indicate measurements for single mice. *, p<0.05; ns, non-significant.
Figure 2
Figure 2. (See also Figure S2). AngII amplifies HSCs and macrophage progenitors via direct signaling through the AGTR1A receptor
A. Cartoon depicting the generation of three different bone marrow chimeras and their use in experiments. #1: reconstituted mice express the Agtr1a receptor on hematopoeitic cells (HC) and on non-HC; #2: reconstituted mice express the Agtr1a receptor on non-HC only and #3: reconstituted mice express the Agtr1a receptor on HC only. All mice were challenged with AngII in vivo (delivered via a mini-pump) before examination of the hematopoietic response. B. Fold increase in the number of splenic HSCs (top) and MDPs (bottom) in AngII-treated mice in groups #1, #2 and #3 (as described in panel A; n=3–4) and when compared to untreated control mice (average from n=4). C. Intravital micrographs of the splenic red pulp from mice that received Agtr1a+/+ (top) or Agtr1a−/− (bottom) EGFP+ HSCs. Left image on top shows Agtr1a+/+ HSC-derived cell clusters at higher magnification. Venous sinuses are in red. Data are representative of 2 mice per condition analyzed. Scale bar represents 1 mm. D. Number of EGFP+ clusters per mm2 of splenic tissue from mice described in panel C. E. Fold expansion of Agtr1a−/− and Agtr1a+/+ HSCs in vitro upon culture for 3 d in complete HSC medium. F. Size of EGFP+ clusters in splenic tissue from mice described in panel C. G. Tracking of monocyte-derived HSCs in vivo. Recipient mice were exposed to AngII and received an i.v. injection of EGFP+ HSCs. The monocyte progeny was quantified 5 d later by flow cytometry. Donor HSCs and recipient mice were either Agtr1a−/− or Agtr1a+/+ as indicated. Data are presented as mean ± SEM. *, p<0.05; **, p<0.01; ns, non-significant. See also Fig S2.
Figure 3
Figure 3. (See also Figure S3). AngII signaling retains HSCs in the spleen in a S1P1-dependent manner
A. Percent of bone marrow (left) and splenic (right) HSC and MDP populations in S/G2 phase of the cell cycle. Cells were obtained from mice treated (+AngII, n=4) or not (Control, n=3) with AngII for 1 wk, stained with DAPI ex vivo and analyzed immediately by flow cytometry. B. Percent chimerism of splenic HSCs in mice parabiosed for 14 d, with each of the parabionts either infused, or not, with AngII. Data show chimerism at the time of separation (0h, n=2) and 1 d later (24h, n=4). C. Percent chimerism of splenic HSCs in mice parabiosed for 30 d, with each of the parabionts bearing KP tumors (+ KP cancer) or not (− KP cancer). Data show chimerism at the time of separation (0h, n=4) and 1 d later (24h, n=4). D. Relative S1p1 mRNA content in splenic HSCs (left) and macrophage progenitors (right) obtained from Agtr1a+/+ or Agtr1a−/− mice. Mice were exposed or not to AngII in vivo for 1 wk, as indicated, and analyzed immediately ex vivo (n=6–7). Values are normalized to S1p1 mRNA expression in wild-type cells obtained from untreated mice (average from n=6). E. Relative S1p1 mRNA expression levels in Agtr1a+/+ (left) and Agtr1a−/− HSCs analyzed immediately (0h, n=2) and after 24h in medium supplemented with 10 μM AngII (24h AngII, n=3); or after 24h in medium alone (24h medium, n=3). F. Ex vivo chemotactic index of splenic Lin CD117+ progenitor cells toward an S1P gradient. Cells were obtained from mice exposed, or not, to AngII in vivo (n=4). (Lin defined as [B220/CD19/CD90.2/DX5/NK1.1/Ly-6G/CD11b/CD11c]). G. Accumulation of splenic HSCs in animals that received i.p. injections of PBS (−FTY720) or FTY720 (+FTY720) for 7 consecutive days (n=5). H. Procedure used to co-inject equal numbers of S1p1norm and S1p1const HSC populations. The progeny of each HSC population was evaluated 7 d later. I. Detection by flow cytometry of the progeny of CD45.2 S1p1norm and CD45.1 S1p1const HSCs. HSC-derived monocytes were defined as CD11b+ Lin [F4/80/ CD11c]lo Ly-6Chi EGFP+ (Lin: [B220/ CD19/ CD90.2/ DX5/ NK1.1/ Ly-6G]). J. Quantification of S1p1norm and S1p1const HSC-derived monocytes (n=8) in mice described in panel I. K. Relative S1p1 mRNA content in splenic progenitors obtained from tumor-free mice (control, n=10), KP mice at wk 12 post tumor initiation (KP, n=10), KP mice that were treated with enalapril for 12 d (KP +enalapril, n=10), and KP mice that were treated with losartan for 7 d (KP +losartan, n=4). Data are presented as mean ± SEM. *, p<0.05; **, p<0.01; ns, non-significant.
Figure 4
Figure 4. (See also Figure S4). Reduction of AngII production impairs the TAM response at its source
A. Procedure used to measure the effects of short-term enalapril administration on splenic and lung responses in mice treated or not for 5 d with enalapril (treatment was initiated 12 wk post tumor initiation). Age-matched, tumor-free untreated mice served as controls B. Quantification of splenic HSCs, MDPs, monocytes and lung macrophages in the cohorts of mice described in panel A (n≥4). C. Procedure used to track the progeny of EYFP+ myeloid progenitor cells transferred into mice with or without lung cancer (±AdCre infection) and treated or not with enalapril. The EYFP+ progenitor cells were injected 11 wk post tumor initiation. The progeny of these cells was evaluated in bone marrow, spleen and lung 5 d later. D. Number of EYFP+ myeloid progenitor-derived monocytes (in bone marrow and spleen) and macrophages (in lungs) in mice described in panel C (n=6–7). E. Procedure used to transplant spleens from donor KP mice (treated or not with enalapril) into recipient KP mice (not treated with enalapril). F. Top: Flow cytometry histogram profiles show donor spleen-derived EYFP+ TAMs that accumulated in the lungs of recipient KP mice (experimental procedure described in panel E). The transplanted spleens were obtained from mice that were previously treated or not with enalapril (±enalapril (donor)). Bottom: Quantification of EYFP+ TAMs derived from donor spleens that were treated (white bars) or not (black bars) with enalapril. Recipient mice were sacrificed and analyzed 1 d post transplantation (n=2). Data in B are presented as mean ± SEM. Data in D are presented as median with dots indicating measurements for single mice. *, p<0.05; **, p<0.01; ns, non-significant.
Figure 5
Figure 5. (See also Figure S5): Prolonged reduction of AngII production restrains the tumor-promoting TAM response and delays tumor mortality in KP mice
A. Quantification of splenic and bone marrow-derived HSCs and MDPs in four cohorts of mice. From left to right: age-matched control mice (−cancer, n=13); tumor-bearing KP mice (+cancer, n=13), KP mice treated with enalapril (+Cancer +enalapril; n=8) and KP mice treated with hydralazine (+cancer +hydralazine; n=3). Tumor-bearing mice were analyzed at 11 wk post tumor initiation. Administration of enalapril or hydralazine started at wk 8. B. Quantification of splenic monocytes (top) and lung macrophages (bottom) in the same mice as in A. C. Phenotypic characterization of lung macrophages. F4/80+ CD11cint/+ Lin macrophages (Lin defined as [B220/CD19/CD90.2/DX5/NK1.1/Ly-6G]lo) were isolated from lungs of control mice (−cancer), tumor-bearing KP mice (+cancer) and tumor-bearing KP mice treated with enalapril (+cancer +enalapril). Mice were analyzed at 11 wk post tumor initiation. Treatment with enalapril started at wk 8. Data show relative mRNA expression levels (real time PCR) normalized to 18s rRNA. Analysis of Actb (Actin-b) expression was included as an internal control. D. Number (top) and total volume (bottom) of lung tumors detected by high resolution CT at 11 wk post tumor initiation in KP mice. The legend identifies mice that started a treatment with enalapril or hydralazine at wk 8. E. Representative 3D volume renderings of tumors at week 11 (Wk 11) from mice treated (bottom) or not (top) with enalapril for 3 consecutive weeks. Tumors are shown in red, lungs in green and bones in yellow. F. Kaplan-Meier survival analysis of KP mice treated (n=12) or not (n=14) with enalapril starting at wk 8 post tumor initiation. Data in A–B and D are presented as median with dots indicating measurements for single mice. Data in C are presented as mean ± SEM. *, p<0.05; **, p<0.01, ***, p<0.001; ns, non-significant.
Figure 6
Figure 6. (See also Figure S6 and Table S1). Agt over-expression in mouse and a subset of human NSCLC
A. Relative Agt mRNA levels in tumor-involved and uninvolved lung tissue of KP mice at 11–12 wk post tumor initiation. Lung tissue of tumor-free mice served as control. mRNA expression is relative to lung tissue of tumor-free mice. Each bar represents a distinct tissue biopsy (n=3 technical replicates per sample). B. Histological detection of Agt protein in the tumor stroma of KP mice at 11 wk post tumor initiation. Center: full view of the lung lobe; top: higher magnification image of uninvolved tissue; bottom: higher magnification image of tumor-involved tissue. Data are representative of 4 mice. Scale bar represents 50 μm. C. Representative examples of detectable AGT protein expression (patient 7D4) or absence thereof (patient 8B4) in lung biopsy specimens from a total of 44 patients with stage 1 NSCLC. AGT staining was scored from 0 to 200 as described in Supplementary Materials and Methods (scores for patient 8B4 is 0 and for patient 7D4 is 95). Scale bar represents 50μm. Known genetic alterations (KRAS) are indicated. Data in A are presented as mean ± SEM

Comment in

References

    1. AbdAlla S, Lother H, Langer A, el Faramawy Y, Quitterer U. Factor XIIIA transglutaminase crosslinks AT1 receptor dimers of monocytes at the onset of atherosclerosis. Cell. 2004;119:343–354. - PubMed
    1. Bangalore S, Kumar S, Kjeldsen SE, Makani H, Grossman E, Wetterslev J, Gupta AK, Sever PS, Gluud C, Messerli FH. Antihypertensive drugs and risk of cancer: network meta-analyses and trial sequential analyses of 324,168 participants from randomised trials. Lancet Oncol. 2011;12:65–82. - PubMed
    1. Biswas SK, Mantovani A. Macrophage plasticity and interaction with lymphocyte subsets: cancer as a paradigm. Nat Immunol. 2010;11:889–896. - PubMed
    1. Cortez-Retamozo V, Etzrodt M, Newton A, Rauch PJ, Chudnovskiy A, Berger C, Ryan R, Iwamoto Y, Marinelli B, Gorbatov R, Forghani R, Novobrantseva TI, Koteliansky V, Figueiredo JL, Chen JW, Anderson DG, Nahrendorf M, Swirski FK, Weissleder R, Pittet M. Origins of tumor-associated macrophages and neutrophils. Proc Natl Acad Sci U S A. 2012;109:2491–2496. - PMC - PubMed
    1. De Palma M, Murdoch C, Venneri MA, Naldini L, Lewis CE. Tie2-expressing monocytes: regulation of tumor angiogenesis and therapeutic implications. Trends Immunol. 2007;28:519–524. - PubMed

Publication types

MeSH terms