. 2013 Jan 31;152(3):642-54.
doi: 10.1016/j.cell.2012.12.033. Epub 2013 Jan 17.

Genome-wide chromatin state transitions associated with developmental and environmental cues

Affiliations

Genome-wide chromatin state transitions associated with developmental and environmental cues

Jiang Zhu et al. Cell. .

Abstract

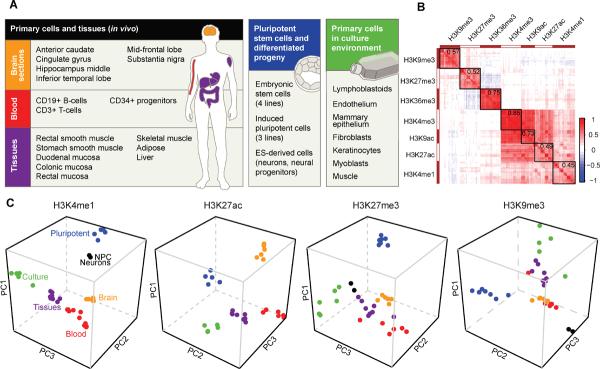
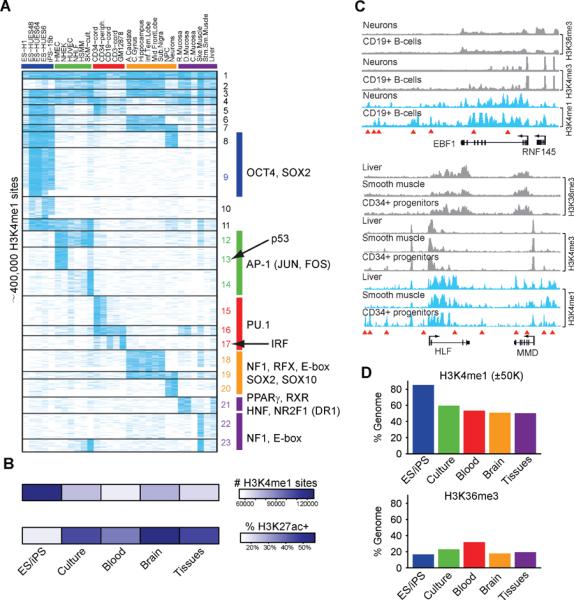
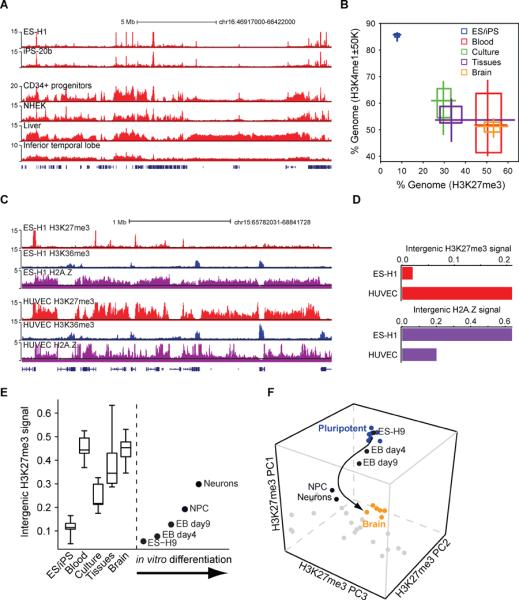
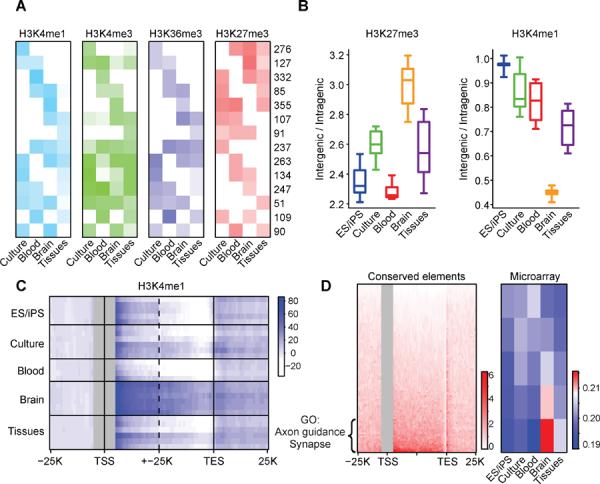
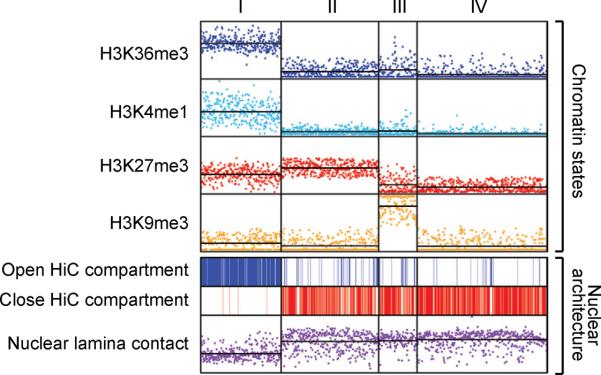
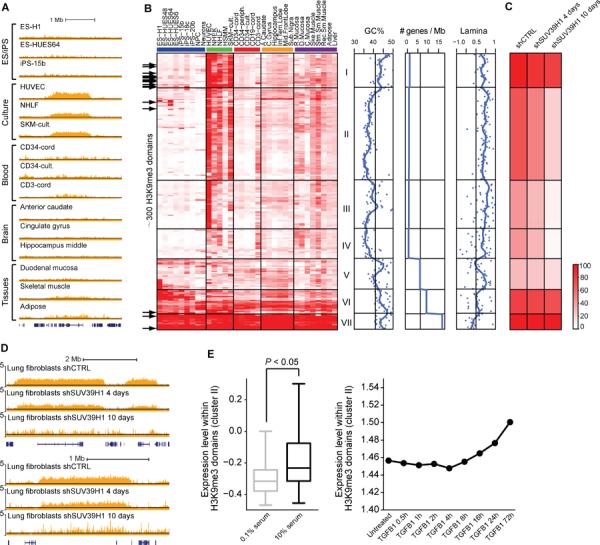
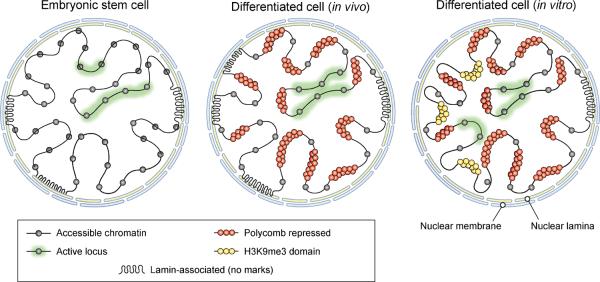
Differences in chromatin organization are key to the multiplicity of cell states that arise from a single genetic background, yet the landscapes of in vivo tissues remain largely uncharted. Here, we mapped chromatin genome-wide in a large and diverse collection of human tissues and stem cells. The maps yield unprecedented annotations of functional genomic elements and their regulation across developmental stages, lineages, and cellular environments. They also reveal global features of the epigenome, related to nuclear architecture, that also vary across cellular phenotypes. Specifically, developmental specification is accompanied by progressive chromatin restriction as the default state transitions from dynamic remodeling to generalized compaction. Exposure to serum in vitro triggers a distinct transition that involves de novo establishment of domains with features of constitutive heterochromatin. We describe how these global chromatin state transitions relate to chromosome and nuclear architecture, and discuss their implications for lineage fidelity, cellular senescence, and reprogramming.


Figures

Figure 1
Figure 1. Chromatin state maps for in vivo tissues, stem cells and primary culture models
(A) Over 300 chromatin state maps were generated for human tissues, stem cells and cultured primary cells. In the schematic, tissues and cells with related phenotypes are grouped and color-coded. (B) Cross-correlation map generated by clustering ~200 histone modification profiles based on pair-wise correlations. Heat indicates degree of positive (red) or negative (blue) correlation between datasets. Mean correlation values over all datasets for each modification are indicated at the upper right of the corresponding block. (C) Projection plots show PCA coordinates for each tissue and cell type (colored as in `A'). The data indicate that coherent variations in the chromatin landscape distinguish cells from different developmental stages, lineages and growth environments. See also Figure S1 and Table S1
Figure 2
Figure 2. Genome-wide annotation of tissue-specific distal regulatory elements
(A) Heatmap depicts H3K4me1 signals (blue) for ~400,000 distal elements (rows) across cell types (columns) arranged by phenotypic groups as in Figure 1A. Clusters of distal elements with similar cell type-specificities (horizontal lines) are enriched for the indicated TF motifs (right). The data emphasize the importance of tissue diversity for understanding distal regulatory elements, a large fraction of which is specific to in vivo tissues. (B) Heatmap indicates the total number of H3K4me1 sites (top) and fraction of H3K4me1 sites that are also enriched for H3K27ac (bottom). Values represent averages for each cell group. (C) H3K36me3, H3K4me3 and H3K4me1 signal tracks are shown for the EBF1 and HLF/MMD loci in the indicated cell types. Red triangles indicate cell type-specific H3K4me1 sites. Although EBF1 is expressed in neurons and CD19+ B-cells, distal H3K4me1 patterns vary markedly between these cell types. Similarly, HLF and MMD are expressed in liver, muscle and CD34+ progenitors, despite stark differences in distal element patterning. (D) Bar graphs show the proportions of genome within 50 kb of an H3K4me1 site (top) or within an H3K36me3 interval (bottom). Values represent averages for each cell group. The prevalence and distribution of H3K4me1 sites suggest that pluripotent cells have more accessible chromatin, but H3K36me3 patterns suggest that total gene activity is similar to other cells. See also Figure S2 and Table S2–S3.
Figure 3
Figure 3. Global chromatin restriction during developmental specification
(A) H3K27me3 signal tracks for a 20 Mb region of chromosome 16 are shown for pluripotent (top) and differentiated (bottom) cell types. (B) Two-dimensional box plot compares the fraction of genome within 50 kb of an H3K4me1 site (y-axis) and the proportion of genome enriched for H3K27me3 (x-axis). For each phenotypic cell group, shaded squares and midpoint indicate 25th, 50th and 75th percentiles, while the crosses designate minimum and maximum values. Specification is accompanied by marked restriction of accessible chromatin and increased prevalence of the Polycomb-repressed state. (C) H3K27me3, H3K36me3 and H2A.Z signal tracks for a 7 Mb region of chromosome 15 are shown for ES cells and endothelial cells. (D) Bar plot contrasts normalized intergenic H2A.Z and H3K27me3 signal distributions in ES and differentiated cells (see Figure S3). These normalized signal distributions are a sensitive indicator of chromatin state transitions. H2A.Z is distributed broadly in pluripotent cells, indicative of genome-wide remodeling, but is confined to sites of regulatory activity in differentiated cells. (E) Box plots indicate normalized intergenic H3K27me3 signal distributions for cells in each phenotypic group. Boxes indicate 25th, 50th and 75th percentiles, while whiskers indicate minimum and maximum values. Corresponding values for ES cell derivatives are indicated at right. (F) H3K27me3 profiles for ES cell derivatives are projected onto PC space as in Figure 1C. The arrow emphasizes the developmental progression. See also Figure S3.
Figure 4
Figure 4. Epigenetic states relate to context-specific genome regulatory programs
(A) Chromatin states are depicted for a set of 100 kb loci with variable activity patterns. Rows correspond to clusters of loci with similar cell type-specificities. Heatmap depicts relative levels of H3K4me1 over distal elements (light blue), H3K4me3 over promoters (green), H3K36me3 over gene bodies (dark blue), and overall H3K27me3 (red) for each cluster in the indicated phenotypic group. Numerical values indicate the number of loci in each cluster. Promoter, gene and distal element activities are largely concordant within a locus, but are exclusive with H3K27me3. (B) Boxplots show H3K27me3 coverage of intergenic regions relative to gene bodies (left), and H3K4me1 peak density in intergenic regions relative to gene bodies (right). Brain sections are notable for a high prevalence of repressive chromatin throughout intergenic regions and a relative confinement of H3K4me1 sites within genes. (C) Heatmap shows composite H3K4me1 profiles over genes and flanking regions (TSS ± 15 kb and TES ± 15 kb; all genes > 15 kb) for each cell type (rows). Brain sections display higher H3K4me1 signals in gene bodies, even when TSS proximal regions (± 5 kb) are masked (gray). (D) Heatmap (left panel) shows the distribution of highly-conserved non-coding sequence elements over gene bodies and flanking regions (TSS ± 25 kb and TES ± 25 kb) for all genes >15 kb (rows). The genes are ordered according to the density of conserved elements within their introns. The top quintile of genes (n=1760) is strongly enriched for functional annotations related to brain physiology, including axon guidance (p < 10−13) and synapse (p < 10−9), and exhibit higher RNA expression in brain (heatmap at right; red indicates high expression; blue indicates low expression). These data suggest that a highly restrictive chromatin structure in specialized brain cells favors access to intronic regions and may influence the function of sequence elements that mediate corresponding regulatory programs. See also Figure S3.
Figure 5
Figure 5. Macro-scale chromatin features and nuclear architecture
Non-overlapping 1 Mb genomic windows (n=2725) were clustered by their coverage by four histone modifications. Roughly half of the windows clustered into four main states: (I) `Active' loci with high H3K36me3 and H3K4me1; (II) `Polycomb-repressed' loci with high H3K27me3; (III) Heterochromatic loci with high H3K9me3; and (IV) `Null' loci devoid of histone modification. The top panel shows coverage for each interval (data points) and average coverage for each cluster (horizontal lines) by the indicated modification. The bottom panel indicates intervals that occupy active (top) or inactive (middle) nuclear compartments, and shows enrichment for nuclear lamina contacts (bottom). The data relate macro-scale modification patterns to genome compartmentalization and nuclear architecture.
Figure 6
Figure 6. Macro-scale chromatin aberrations in cultured cells
(A) H3K9me3 signal tracks for representative cell types are shown for a 3.5 Mb region of chromosome 16 that contains a culture-specific H3K9me3 domain. (B) Heatmap shows normalized H3K9me3 signals for 296 H3K9me3 domains (rows) in the indicated cell types (columns). The domains are clustered into seven groups based on their cell type-specificities. GC content, gene density and nuclear lamina contact enrichment are plotted for each cluster (right). Black arrows (left) indicate domains that coincide with loci found to have aberrant DNA methylation patterns in iPS cells (Lister et al., 2011). (C) For each cluster in (B), heatmap shows H3K9me3 signals in lung fibroblasts after 4 or 10 days of Suv39h1 knock-down. (D) H3K9me3 signal tracks for two culture-specific domains are shown for lung fibroblasts after 4 or 10 days of Suv39h1 knock-down. (E) Boxplot (left) shows expression levels of genes within culture-specific H3K9me3 domains (cluster II) in fibroblasts cultured in high or low serum. P-value of Wilcoxon rank-sum test is shown. Median expression levels for these genes are also shown for lung adenocarcinoma cells undergoing TGF-β-mediated EMT. See also Figure S4 and Table S4.
Figure 7
Figure 7. Model for large-scale chromatin state transitions
Illustration depicts large-scale chromatin patterns and their relative prevalence in cells from different developmental stages or environments. Although the amount of genome sequence engaged in gene regulatory activity is relatively consistent, the chromatin configuration of inactive regions varies considerably. In ES cells (left), inactive regions are diffusely enriched for markers of chromatin exchange and accessibility. In differentiated cells acquired in vivo (middle), inactive loci instead tend to adopt a Polycomb-repressed chromatin state. In differentiated cells cultured in vitro (right), large domains enriched for the heterochromatin marker H3K9me3 arise in regions associated with the nuclear lamina.

Similar articles

Cited by

References

    1. Adams PD. Remodeling of chromatin structure in senescent cells and its potential impact on tumor suppression and aging. Gene. 2007;397:84–93. - PMC - PubMed
    1. Adli M, Zhu J, Bernstein BE. Genome-wide chromatin maps derived from limited numbers of hematopoietic progenitors. Nature methods. 2010;7:615–618. - PMC - PubMed
    1. Angel P, Karin M. The role of Jun, Fos and the AP-1 complex in cell-proliferation and transformation. Biochim Biophys Acta. 1991;1072:129–157. - PubMed
    1. Bernstein BE, Stamatoyannopoulos JA, Costello JF, Ren B, Milosavljevic A, Meissner A, Kellis M, Marra MA, Beaudet AL, Ecker JR, et al. The NIH Roadmap Epigenomics Mapping Consortium. Nature biotechnology. 2010;28:1045–1048. - PMC - PubMed
    1. Bock C, Kiskinis E, Verstappen G, Gu H, Boulting G, Smith ZD, Ziller M, Croft GF, Amoroso MW, Oakley DH, et al. Reference Maps of human ES and iPS cell variation enable high-throughput characterization of pluripotent cell lines. Cell. 2011;144:439–452. - PMC - PubMed

Publication types