. 2013 Mar 7;12(3):329-41.
doi: 10.1016/j.stem.2012.12.013. Epub 2013 Jan 17.

BCL-2 inhibition targets oxidative phosphorylation and selectively eradicates quiescent human leukemia stem cells

Affiliations

BCL-2 inhibition targets oxidative phosphorylation and selectively eradicates quiescent human leukemia stem cells

Eleni D Lagadinou et al. Cell Stem Cell. .

Abstract

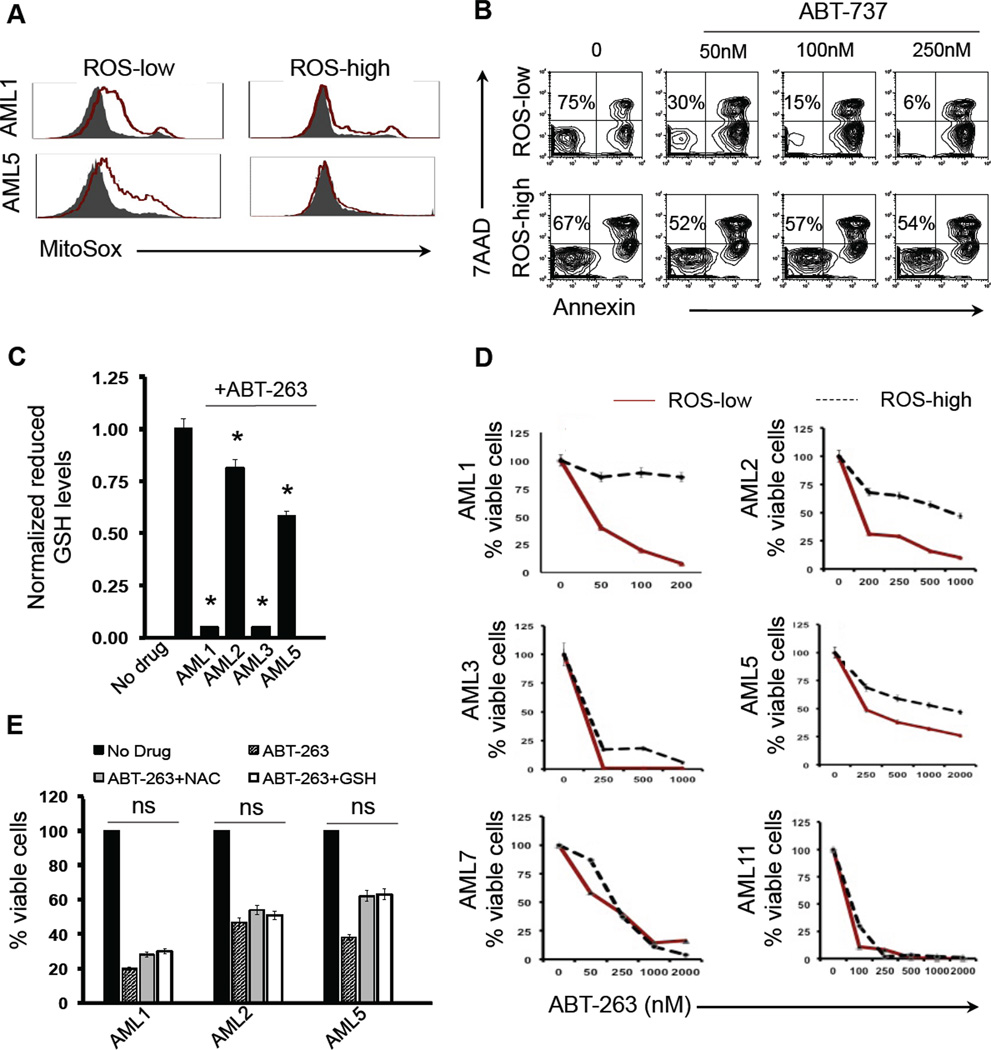
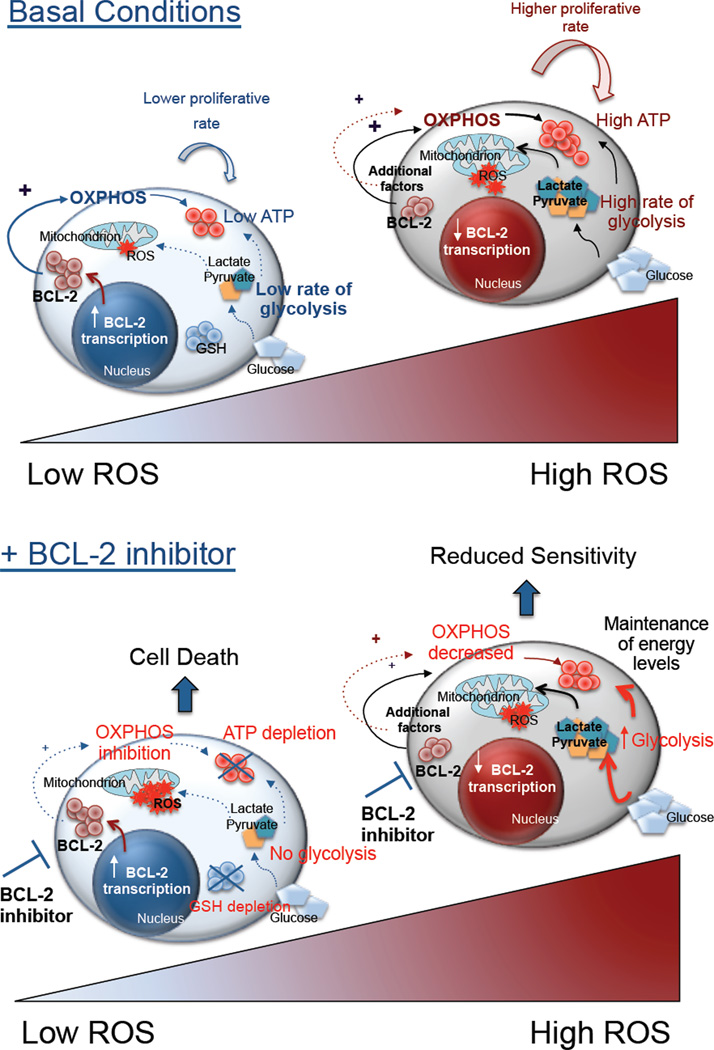
Most forms of chemotherapy employ mechanisms involving induction of oxidative stress, a strategy that can be effective due to the elevated oxidative state commonly observed in cancer cells. However, recent studies have shown that relative redox levels in primary tumors can be heterogeneous, suggesting that regimens dependent on differential oxidative state may not be uniformly effective. To investigate this issue in hematological malignancies, we evaluated mechanisms controlling oxidative state in primary specimens derived from acute myelogenous leukemia (AML) patients. Our studies demonstrate three striking findings. First, the majority of functionally defined leukemia stem cells (LSCs) are characterized by relatively low levels of reactive oxygen species (termed "ROS-low"). Second, ROS-low LSCs aberrantly overexpress BCL-2. Third, BCL-2 inhibition reduced oxidative phosphorylation and selectively eradicated quiescent LSCs. Based on these findings, we propose a model wherein the unique physiology of ROS-low LSCs provides an opportunity for selective targeting via disruption of BCL-2-dependent oxidative phosphorylation.


Figures

Figure 1
Figure 1. Stem cell properties of leukemia cells isolated on the basis of intracellular ROS
A) CM-H2DCFDA labeling of primary AML specimen. DCF; CM-H2DCFDA. See also Figures S1A–B. B) Representative cell cycle analysis of sorted ROS-low and ROS-high primary AML subsets performed by Ki-67 and 7AAD labeling. In C, cell cycle analyses from n=9 primary AML samples are summarized. Mean±SEM percentages of G0 cells are plotted. See also Figures S1C–E. D) Number of colonies per 5×10⁴ cultured cells in total AML, ROS-low and ROS-high subsets. Mean±SEM values of n=4 primary AML specimens are plotted. E) Total AML, ROS-low and ROS-high leukemia subsets were transplanted in NSG mice at a constant cell ratio of 5:1:1 as described in Materials and Methods. Mice were killed 6–8 weeks after, and their marrow was analyzed for engraftment of human leukemia cells by flow cytometry. Results from n=5 independent AML specimens are shown. See also Figure S1F.
Figure 2
Figure 2. Bio-energetic analyses in LSC-enriched vs bulk leukemic and normal primitive populations
A) Basal oxygen consumption rate (OCR) in total AML and ROS-low cells vs ROS-high subsets, as evaluated by the Seahorse XF24 extracellular Flux analyzer. 5 replicate wells of 5×10⁵ ROS-low and high leukemic cells were analyzed. Mean±SEM values from n=5 AML specimens are plotted. *: P ≤ 0.05. See also Figure S2. B) Protein expression levels of the NADPH oxidase subunit NOX2 (gp91phox) in ROS-low vs ROS-high primary subsets, as evaluated by flow cytometry. Mean fluorescence intensity values are plotted. AU: arbitrary units C) Mean±SEM values of baseline extracellular acidification rate (ECAR) indicative of glycolytic rate in n=5 primary AML specimens. *: P ≤ 0.05. D) Reserved glycolytic capacity in ROS-low cells (red) vs ROS-high AML cells (black) in a primary AML specimen. ECAR was measured without (first two measurements) and in the presence (measurements 3 – 8) of the mitochondrial inhibitors Oligomycin (OLI, 1µg/ml), FCCP (1µM) and Antimycin (AA, 5µM). Basal ECAR is calculated as the mean of measurements 1 & 2. Reserved glycolytic capacity is determined as the mean of the measurements 5 & 6 minus the mean of the first two measurements. E) Mean±SEM values of reserved glycolytic capacity in n=5 primary AML specimens. *: P ≤ 0.05. F) Mean values of baseline ATP levels in ROS-low vs high leukemia cells. G) Reserved glycolytic capacity in normal CD34+ (red) vs CD34− (black) marrow cells, representative experiment. Mean±SEM values of reserved glycolytic capacity from 2 independent experiments in CD34+ vs CD34− normal subsets are plotted in H. Reserved glycolytic capacity was determined as in D. *: P ≤ 0.05. I) Basal oxygen consumption rate (OCR) of normal marrow CD34+ vs CD34− subsets. Mean±SEM values are plotted.
Figure 3
Figure 3. BCL-2 is up-regulated in LSC enriched primary AML populations
A) Heat map of relative expression of energy and mitochondrial-related genes in ROS-low AML cells compared to ROS-high cells (Green=down - regulated, Red=up - regulated). RNA was isolated from each purified population from n=3 independent AML specimens and subjected to whole transriptome analysis (RNA-seq) as described in materials and methods. The two-sample homoscedastic, independent t-test was used for comparing the states described. P ≤ 0.05 was set as significant. See also Figures S3A–B. In B, normalized BCL-2 gene expression as determined by quantitative Real Time PCR in ROS-high as compared to ROS-low AML subsets. Mean±SEM values of n=7 primary AML specimens are presented; (*: P ≤ 0.05). C) Western blot analyses of BCL-2 protein levels in ROS-low vs ROS-high leukemia cells. See also Figures S3C–H.
Figure 4
Figure 4. BCL-2 inhibitors target LSC mitochondrial energy generation
In A and B are presented plots of oxygen consumption rate (OCR, oxidative metabolism) as a parameter of time in the absence (measurements 1–4), and in the presence of 250nM ABT-263 (indicated by black arrow, measurements 4–12) in total AML and ROS-high primary AML subsets (A) and in LSC-enriched ROS-low cells (B). 5 replicate wells of 1×10⁶ total AML, ROS-low and ROS-high leukemic cells were analyzed. Consecutive measurements (1–12) in both plots were performed every 15min. In C, CD34+ cells isolated from normal bone marrow were analyzed similarly to A. See also Figures 4SA–B. In D extracellular acidification rate (ECAR, glycolytic rate) is plotted as a parameter of time in total AML, ROS-low and ROS-high subsets, and in normal marrow CD34+ cells in the absence (measurements 1–4) and in the presence of 250nM ABT-263 (measurements > 4). E) ATP levels in ROS-low vs high AML subsets +/− ABT-263 (250nM, 6hr), and in normal marrow CD34+ cells treated either with ABT-263 alone (250nM, 6hr) or ABT-263 (250nM) and 2-deoxyglucose (2-DG, 5mM) for 6hr. Normalized mean values of treated cells as compared to untreated controls (presented as equal to 1) are plotted. *P ≤ 0.05. F) 2 independent primary AML specimens were transduced with shRNA targeting BCL-2 by means of lentiviral vectors, as described in materials and methods. BCL-2 knock-down was confirmed by quantitative RT-PCR (supplementary Figure S4C). Baseline oxygen consumption rate (OCR) indicative of oxidative respiration, was analyzed in cells transduced with BCL-2 shRNA and empty vector, and is plotted. Mean±SEM of two independent experiments are shown. *≤ 0.05. G) Primary AML cells transduced with BCL-2 shRNA vs empty vector were treated with ABT-263 (1µM). OCR values 60min after treatment are plotted as normalized % values of baseline (no drug) values for each sample. Mean±SEM of two independent experiments are shown. *≤ 0.05. See also Figures S4D–F.
Figure 5
Figure 5. Bcl-2 inhibitors induce mitochondrial oxidation and cell death in the LSC compartment
A) Mitochondrial ROS, as evaluated by the mitochondrial-specific redox probe MitoSox in ROS low vs ROS-high AML subsets treated with 250nM ABT-263 for 6hr. Grey filled: Untreated; Red line: +ABT-263. See also Figure S5. B) Flow cytometric cell death analysis of ROS-low and ROS-high leukemia cells in an AML specimen treated for 18hr with increasing concentrations of the BCL-2 inhibitor ABT-737. Treated and control cells were labeled with Annexin V and 7AAD and analyzed by flow cytometry. The number of viable (Ann / 7AAD) cells is shown. C) Reduced GSH levels in primary ROS-low cells subjected to 250nM ABT-263 for 6hr. Normalized mean values of treated cells as compared to untreated controls (presented as equal to 1) are plotted in n=4 AML specimens. *P ≤ 0.05. In D, in vitro cell death analyses of ROS-low vs high AML populations in n=6 AML specimens are shown. Results are expressed as the ratio of the mean viable (Ann / 7AAD) treated cells to the mean viable cells of untreated controls. Red: ROS-low; Black: ROS-high. E) In vitro viability of ROS-low cells treated for 18hr with 250nM ABT-263 alone, or ABT-263 in combination with 1mM NAC or 1mM GSH ester. Mean values from duplicate experiments in 3 independent AML specimens are plotted. *P ≤ 0.05.
Figure 6
Figure 6. Bcl-2 inhibition target drug-resistant LSC
A) Colony forming potential of primary AML cells transduced with BCL-2 shRNAs or empty vector. Mean±SEM values of two independent experiments in triplicate are shown. B) Ex vivo cell death analysis of LSC enriched ROS-low cells treated with ABT-263 in 3 independent AML specimens. Cells were cultured overnight in vitro with ABT-263 concentrations equal to the IC50 drug dose for total AML cells, and then injected in NSG mice. % engraftment of human cells is plotted. *: P ≤ 0.05; ns: not significant. See also Figure S6. C) % engraftment of human leukemia cells in NSG mice treated in vivo with vehicle (control) or ABT-737 (50mg/kg, IP for 14 daily doses). D) Human engrafted cells from mice treated in vivo with ABT-737 and respective cells from mice treated with vehicle (control) from the experiment shown in B were isolated, and equal numbers of cells were transplanted in secondary recipients. Mice were analyzed for engraftment of human leukemic cells 8 weeks after. E) In vitro cell death analysis of normal bone marrow cells treated with ABT-263 (250nM, 18hr), after gating in the CD34+ hematopoietic progenitor compartment. F) Normal bone marrow cells were treated in vitro with ABT-263 (250nM, 18hr) followed by methylcellulose culture to measure colony formation ability; Mean±SEM values of two independent experiments in triplicate are shown. ns: not significant. G) Ex vivo cell death analysis of normal bone marrow total mononuclear cells cultured overnight in vitro with 250nM ABT-263 and subsequently injected in NSG mice. % engraftment of human cells is plotted.
Figure 7
Figure 7. Model for selective targeting of LSCs by Bcl-2 inhibition
AML ROS-low cells under baseline conditions (upper panel) are characterized, as compared to AML ROS-high cells, by: a) quiescence, b) low overall intracellular ROS, c) low metabolism that generates energy through oxidative respiration rather than glycolysis, d) transcriptional up-regulation of BCL-2. BCL-2 positively regulates energy generation in AML ROS-low and high subsets through up-regulating oxidative respiration. AML ROS-high cells employ additional mechanisms to maintain a significantly higher metabolic / energetic state as compared to AML ROS-low. Based on the increased expression of BCL-2 in AML ROS-low cells, and their selective dependency on oxidative respiration for energy homeostasis, upon BCL-2 pharmacologic inhibition by treatment with ABT-263 (lower panel): a) the OXPHOS of AML ROS-low cells is dramatically reduced, b) those cells can not increase glycolysis so as to maintain energy supply, c) ATP levels are depleted followed by d) increase in mitochondrial ROS e) reduction in cellular glutathione and f) induction of apoptotic cell death. AML ROS-high cells can more efficiently preserve energy supplies in response to BCL-2 pharmacologic inhibition, mainly by up-regulating the glycolytic machinery.

Comment in

References

    1. Cairns RA, Harris IS, Mak TW. Regulation of cancer cell metabolism. Nature reviews Cancer. 2011;11:85–95. - PubMed
    1. Chen ZX, Pervaiz S. Bcl-2 induces pro-oxidant state by engaging mitochondrial respiration in tumor cells. Cell Death Differ. 2007;14:1617–1627. - PubMed
    1. Del Poeta G, Venditti A, Del Principe MI, Maurillo L, Buccisano F, Tamburini A, Cox MC, Franchi A, Bruno A, Mazzone C, et al. Amount of spontaneous apoptosis detected by Bax/Bcl-2 ratio predicts outcome in acute myeloid leukemia (AML) Blood. 2003;101:2125–2131. - PubMed
    1. Delia D, Aiello A, Soligo D, Fontanella E, Melani C, Pezzella F, Pierotti MA, Della Porta G. bcl-2 proto-oncogene expression in normal and neoplastic human myeloid cells. Blood. 1992;79:1291–1298. - PubMed
    1. Diehn M, Cho RW, Lobo NA, Kalisky T, Dorie MJ, Kulp AN, Qian D, Lam JS, Ailles LE, Wong M, et al. Association of reactive oxygen species levels and radioresistance in cancer stem cells. Nature. 2009;458:780–783. - PMC - PubMed

Publication types

MeSH terms