. 2013 Mar 7;12(3):316-28.
doi: 10.1016/j.stem.2012.12.011. Epub 2013 Jan 17.

A Pan-BCL2 inhibitor renders bone-marrow-resident human leukemia stem cells sensitive to tyrosine kinase inhibition

Affiliations

A Pan-BCL2 inhibitor renders bone-marrow-resident human leukemia stem cells sensitive to tyrosine kinase inhibition

Daniel J Goff et al. Cell Stem Cell. .

Abstract

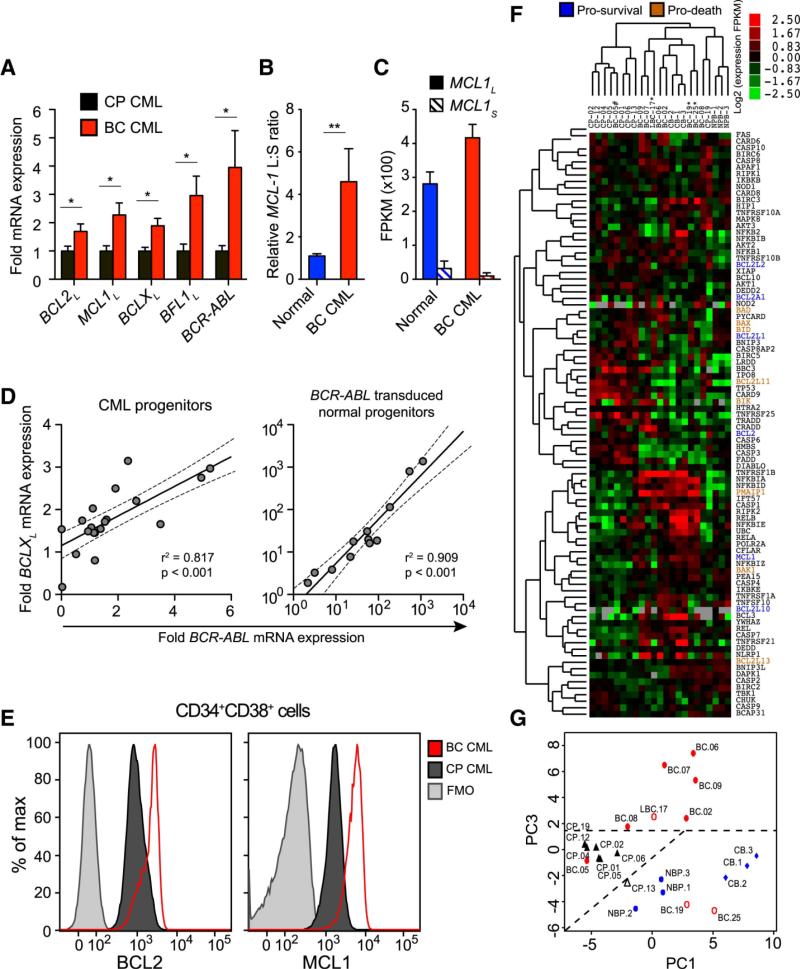
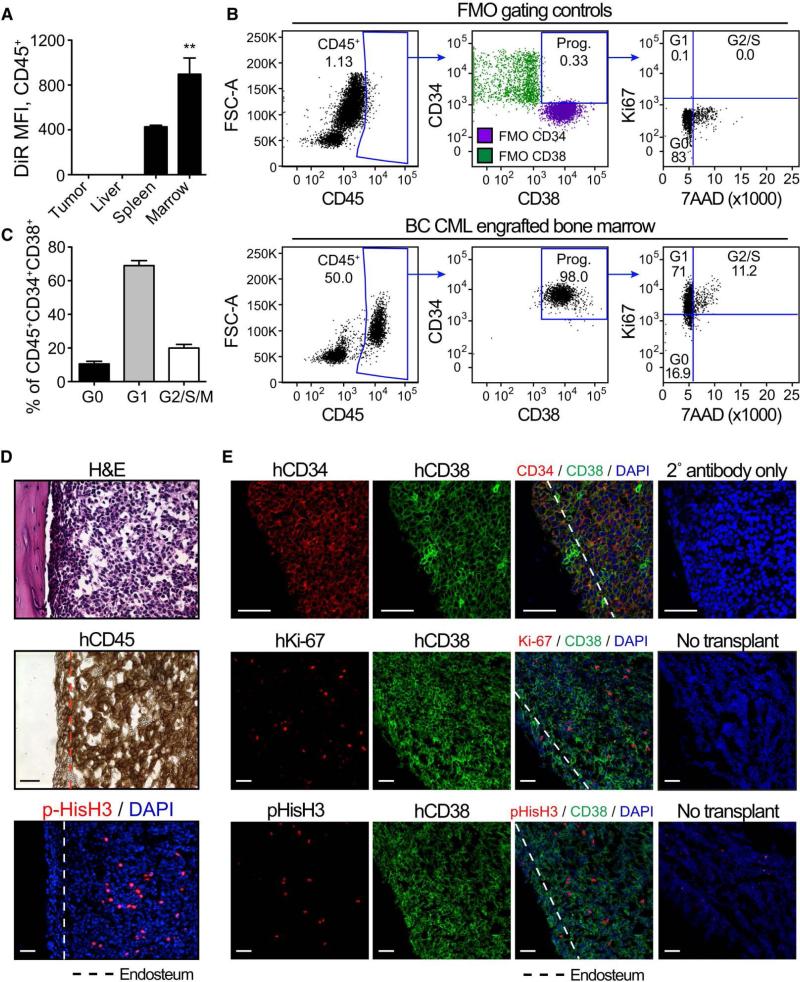
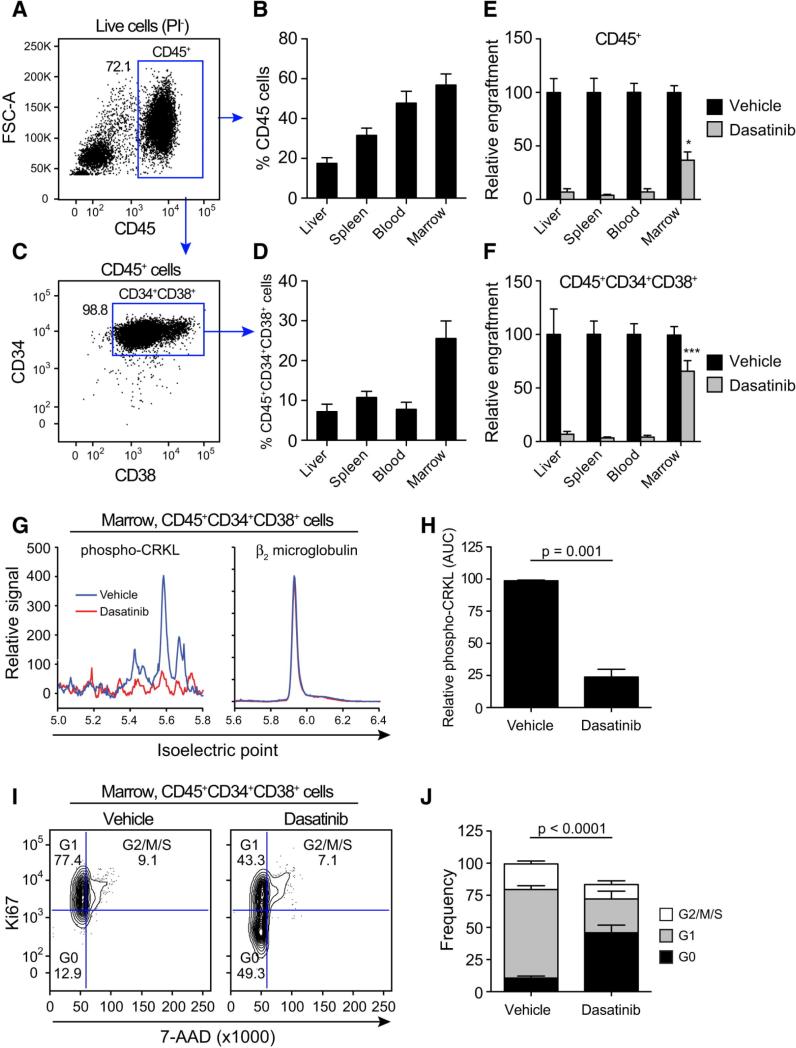
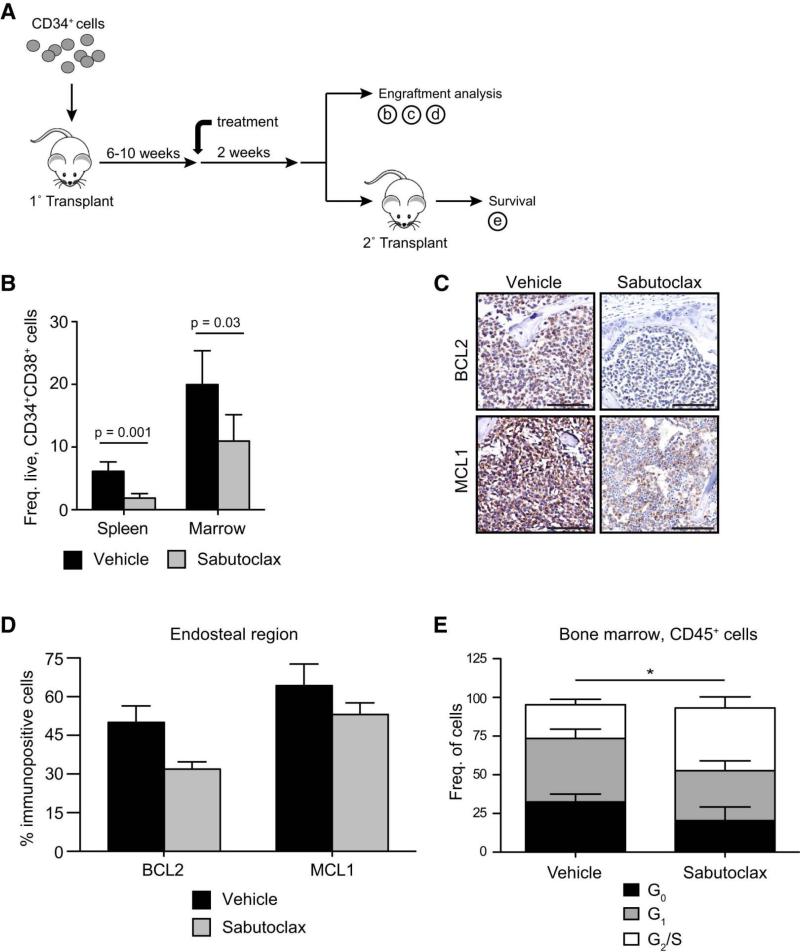
Leukemia stem cells (LSCs) play a pivotal role in the resistance of chronic myeloid leukemia (CML) to tyrosine kinase inhibitors (TKIs) and its progression to blast crisis (BC), in part, through the alternative splicing of self-renewal and survival genes. To elucidate splice-isoform regulators of human BC LSC maintenance, we performed whole-transcriptome RNA sequencing, splice-isoform-specific quantitative RT-PCR (qRT-PCR), nanoproteomics, stromal coculture, and BC LSC xenotransplantation analyses. Cumulatively, these studies show that the alternative splicing of multiple prosurvival BCL2 family genes promotes malignant transformation of myeloid progenitors into BC LSCS that are quiescent in the marrow niche and that contribute to therapeutic resistance. Notably, sabutoclax, a pan-BCL2 inhibitor, renders marrow-niche-resident BC LSCs sensitive to TKIs at doses that spare normal progenitors. These findings underscore the importance of alternative BCL2 family splice-isoform expression in BC LSC maintenance and suggest that the combinatorial inhibition of prosurvival BCL2 family proteins and BCR-ABL may eliminate dormant LSCs and obviate resistance.


Figures

Figure 1
Figure 1
see also Figure S1 and Table S1 and S2 a) qRT-PCR of pro-survival (long isoforms) BCL2, MCL1, BCLX, BFL1 and BCR-ABL mRNAs in primary CP (black, n=13) and BC (red, n=11) progenitors. Values are normalized to human HPRT mRNA expression. Graphs show mean +/− SEM; * p<0.05 by unpaired t-test. b) Relative ratio of MCL1 long to short isoforms in normal (n=7) and BC (n=8) progenitors. Graph shows mean +/− SEM; ** p<0.01 by unpaired t-test. c) Whole transcriptome sequencing of FACS-sorted progenitor cells from a normal and a BC sample showing quantification of MCL1L and MCL1S isoforms in each sample. Graph shows fragments per kilobase of exon per million fragments mapped (FPKM) +/− 95% confidence interval. Graphs show mean +/− SEM d) Correlation between BCR-ABL mRNA expression and BCLXL mRNA expression in progenitors. Left: Primary CP and BC samples (n=20). Right: BCR-ABL transduced normal progenitor colonies (n=12). Both graphs depict best-fit line and 95% confidence intervals by Pearson correlation analysis. e) Representative FACS histograms of BCL2 and MCL1 protein expression in CP progenitors (black) versus BC progenitors (red). Fluorescence minus one (FMO) controls are shown in grey. f) Full transcriptome RNA sequencing analysis of survival-pathway genes in FACS-sorted (CD45+CD34+CD38+LIN) progenitors from 3 normal cord blood (CB), 3 normal adult peripheral blood (NP), 8 CP, 1 lymphoid BC (LBC) and 8 BC samples. Heat map depicts log2 fold FPKM. BCL2 family genes are highlighted and their functions are indicated by blue (pro-survival) or orange (pro-death) coloring. g) Unsupervised principal component analyses of the survival pathway genes for FACS-sorted CD45+CD34+CD38+LIN progenitors from 3 normal cord blood (CB), 3 normal adult peripheral blood (NP), 8 CP, 1 lymphoid BC (LBC) and 8 BC samples.
Figure 2
Figure 2
see also Figure S2 and S3 and Table S3 a) Retained DiR fluorescence of BC progenitors (CD45+CD34+CD38+LIN) engrafted in tumor (n=4), liver (n=4), spleen (n=3), and bone marrow (n=2) 18 weeks after DiR surface staining and transplant. Graph shows mean +/− SEM; *** p<0.001 by ANOVA and Tukey post-hoc analysis. b) Representative FACS plots showing gating and cell cycle analysis of live (PI), bone marrow-engrafted BC progenitors (CD45+CD34+CD38+LIN). FMO gating controls are shown in the top row, while engrafted bone marrow is shown in the bottom row. c) Quantification of BC progenitors in untreated marrow in the different phases of the cell cycle. N=10 engrafted bones. Graph shows mean +/− SEM. d-e) Histological analysis of engrafted bone marrow showing H&E, human CD34, CD38 and Ki67, and pHis-H3 staining. The dotted lines delineate the endosteum (~50μm from the bone edge). All scale bars equal 50μm.
Figure 3
Figure 3
see also Figure S4 a) Representative FACS plots (Live cells PI) showing human CD45 engraftment in mouse bone marrow. Percentages shown are based on parental population as indicated. b) Total human CD45 engraftment in liver, spleen, blood, and bone marrow of BC transplanted mice (n=31) for 3 different CML BC patients samples. Graphs show mean +/− SEM. c) Representative FACS plots showing human BC progenitors (CD45+CD34+CD38+LIN) engraftment in mouse bone marrow. d) Total engraftment of progenitors in the hematopoietic organs of BC transplanted mice (n=31) for 3 different CML BC patients samples. Values are a back gated calculation, based on the percentage of CD45+ cells = (% of CD45+ cells) x (% of CD34+CD38+ cells). Graphs show mean +/− SEM. e) Relative engraftment (% of vehicle treated controls) of human CD45 cells in the hematopoietic organs following treatment with vehicle (n=13) or dasatinib (50mg/kg, n=14). Statistical analysis is shown comparing the residual engraftment in each tissue (grey bars) and depicts the results of ANOVA with Tukey post-hoc comparisons; * p<0.05. Graphs show mean +/− SEM. f) Relative engraftment (% of vehicle treated controls) of progenitors in the hematopoietic organs following treatment with vehicle (n=19) or dasatinib (n=19). Statistical analysis is shown comparing the residual engraftment in each tissue (grey bars) and depicts the results of ANOVA with Tukey post-hoc comparisons; *** p<0.001. Graphs show mean +/− SEM. g) Representative proteomics plots showing analysis of phosphorylated-CRKL (left) and β2 microglobulin (right) in BC progenitors sorted from engrafted mouse bone marrow and after treatment with either vehicle or dasatinib. h) Quantification of total area under the curve (AUC) of phosphorylated-CRKL peaks in vehicle (n=5) and dasatinib (n=5) treated samples. All values are normalized β2 microglobulin protein expression in the same sample. Graphs show mean +/− SEM. i) Representative FACS-cell cycle plots of live, CD45+ BC progenitors engrafted in marrow following vehicle and dasatinib treatment. j) Cell cycle status of live, CD45+ BC progenitors sorted from the marrow and following treatment with vehicle (n=10) or dasatinib (n=10). All graphs in figure 3 show mean +/− SEM. All statistical analyses are by unpaired t-test.
Figure 4
Figure 4
see also Figure S5 a) BCL2 family RT2 Profiler PCR Array System data of FACS-sorted progenitors from engrafted mice (n=3). The graph depicts fold expression in marrow-engrafted progenitors relative to spleen-engrafted progenitors, which are set at 1. Graphs show mean +/− SEM. p<0.05 by unpaired t-test b) BCL2L mRNA isoform expression and BCL2 protein expression in marrow versus spleen-engrafted BC progenitors. c) Representative immunohistochemical analysis of gross (top) and endosteal (bottom) engraftment of human CD34+, BCL2+ and MCL1+ cells in mouse bone marrow. Scale bars equal 1mm in low-magnification images and 100μm in high-magnification images. d) Representative images showing immunofluorescence analysis of hCD38+ and hBCL2+ cells in BC CML engrafted marrow compared to no-transplant control marrow. All scale bars equal 50μm. The boxed area shows a close-up of the endosteal region.
Figure 5
Figure 5
see also Figure S6 and Table S4 and S5 a) In vitro experimental design used in the present studies. b) FACS analysis of activated caspase-3+ CML progenitors following in vitro culture with BI-97C1 (sabutoclax). Graph shows mean +/− SEM from 3 independent experiments. c) FACS analysis of normal (blue) and BC (red) progenitors cultured on SL/M2 bone marrow stroma in the presence of sabutoclax. All values are normalized to vehicle treated control. Graph shows mean +/− SEM from 5 different normal and BC samples. d) Total colonies formed by normal (blue) and BC (red) progenitors following sabutcolax treatment. All values are normalized to vehicle treated control. Graph shows mean +/− SEM from 3 different normal and 3 BC samples. Panel c and d show best-fit lines and statistical comparisons by non-linear regression analysis. e) Left: Representative colonies from control or sh-BCL2 transduced progenitors. Right: qRT-PCR of BCL2L mRNA in normal or BC cells following transduction with control and sh-BCL2 lentivirus (n=3 colonies for each sample type). Graph shows mean +/− SEM. f) Number of colonies formed by FACS-sorted normal (blue) or BC (red) progenitors following transduction with control or sh-BCL2 lentivirus. Graph shows average colonies per well for 4 different normal and BC samples and statistical analysis by paired t-test.
Figure 6
Figure 6
see also Figure S7 and Table S6 a) In vivo experimental design used in the present studies. b) Engraftment of BC progenitors in spleen and bone marrow following vehicle (n=27) and sabutoclax treatment (5mg/kg, n=26). Graph shows mean +/− SEM for 3 different BC patient samples and statistical analysis by Mann-Whitney test. c) Representative immunohistochemical analysis of BCL2 and MCL1 staining in engrafted bone marrow following vehicle and sabutoclax treatment. Scale bars equal 100μm. d) Quantification of BCL2+ and MCL1+ cells in the endosteum of engrafted bone marrow following vehicle (n=3) and sabutoclax (n=3) treatment. Graph shows mean +/− SEM. e) FACS-cell cycle analysis of CD45+ bone marrow engrafted BC cells in vehicle (n=6) and sabutoclax (n=5) treated mice. Graph shows mean +/− SEM. *p<0.05 by unpaired t-test.
Figure 7
Figure 7
a) Representative TUNEL staining of BC-engrafted bone marrow following treatment with vehicle or sabutoclax. b) Relative engraftment of normal and BC progenitors in bone marrow following vehicle and sabutoclax treatment (5mg/kg). Normal: vehicle n=6, sabutoclax n=6. BC: vehicle n=26, sabutoclax n=27. Graph shows mean +/− SEM and statistical analysis by Mann-Whitney test. c) Fold change of normal stem cell in the bone marrow after treatment with Vehicle (n=8); Sabutoclax 10 mg/kg IV, biweekly for 4 doses (n=8); Dasatinib 50 mg/kg, daily oral gavage, 14 doses total (n=11); combination of Sabutoclax and Dasatinib (n=10). Graph shows mean +/− SEM. d) Fold change of normal stem cell in the spleen after treatment with Vehicle (n=8); Sabutoclax 10 mg/kg IV, biweekly for 4 doses (n=8); Dasatinib 50 mg/kg, daily oral gavage, 14 doses total (n=11); combination of Sabutoclax and Dasatinib (n=10). Graph shows mean +/− SEM. e) Relative engraftment of BC progenitors in spleen, blood and bone marrow following treatment with vehicle (n=9), sabutoclax (1.25mg/kg, n=9), dasatinib (25mg/kg, n=9) and sabutoclax in combination with dasatinib (n=11). Graph shows mean +/− SEM. * p<0.05, ** p<0.01, *** p<0.001 by Kruskal-Wallis test with Dunn's post-hoc analysis. f) Survival of mice following serial transplanted with vehicle-(n=11), sabutoclax- (n=9), dasatinib- (n=9), and combination- (n=13) treated whole bone marrow. Statistical analysis is by log-rank test.

Comment in

References

    1. Abe A, Minami Y, Hayakawa F, Kitamura K, Nomura Y, Murata M, Katsumi A, Kiyoi H, Jamieson CH, Wang JY, et al. Retention but significant reduction of BCR-ABL transcript in hematopoietic stem cells in chronic myelogenous leukemia after imatinib therapy. Int J Hematol. 2008;88:471–475. - PMC - PubMed
    1. Abrahamsson AE, Geron I, Gotlib J, Dao KH, Barroga CF, Newton IG, Giles FJ, Durocher J, Creusot RS, Karimi M, et al. Glycogen synthase kinase 3beta missplicing contributes to leukemia stem cell generation. Proceedings of the National Academy of Sciences of the United States of America. 2009;106:3925–3929. - PMC - PubMed
    1. Aichberger KJ, Mayerhofer M, Krauth MT, Skvara H, Florian S, Sonneck K, Akgul C, Derdak S, Pickl WF, Wacheck V, et al. Identification of mcl-1 as a BCR/ABL-dependent target in chronic myeloid leukemia (CML): evidence for cooperative antileukemic effects of imatinib and mcl-1 antisense oligonucleotides. Blood. 2005;105:3303–3311. - PubMed
    1. Akgul C, Moulding DA, Edwards SW. Alternative splicing of Bcl-2-related genes: functional consequences and potential therapeutic applications. Cell Mol Life Sci. 2004;61:2189–2199. - PMC - PubMed
    1. Amarante-Mendes GP, McGahon AJ, Nishioka WK, Afar DE, Witte ON, Green DR. Bcl-2-independent Bcr-Abl-mediated resistance to apoptosis: protection is correlated with up regulation of Bcl-xL. Oncogene. 1998;16:1383–1390. - PubMed

Publication types

MeSH terms

Substances