. 2013 Feb:172:8-17.
doi: 10.1016/j.bpc.2012.12.005. Epub 2012 Dec 26.

Analysis of a glucocorticoid-estrogen receptor chimera reveals that dimerization energetics are under ionic control

Affiliations

Analysis of a glucocorticoid-estrogen receptor chimera reveals that dimerization energetics are under ionic control

Keith D Connaghan et al. Biophys Chem. 2013 Feb.

Abstract

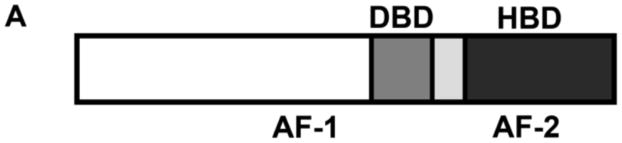
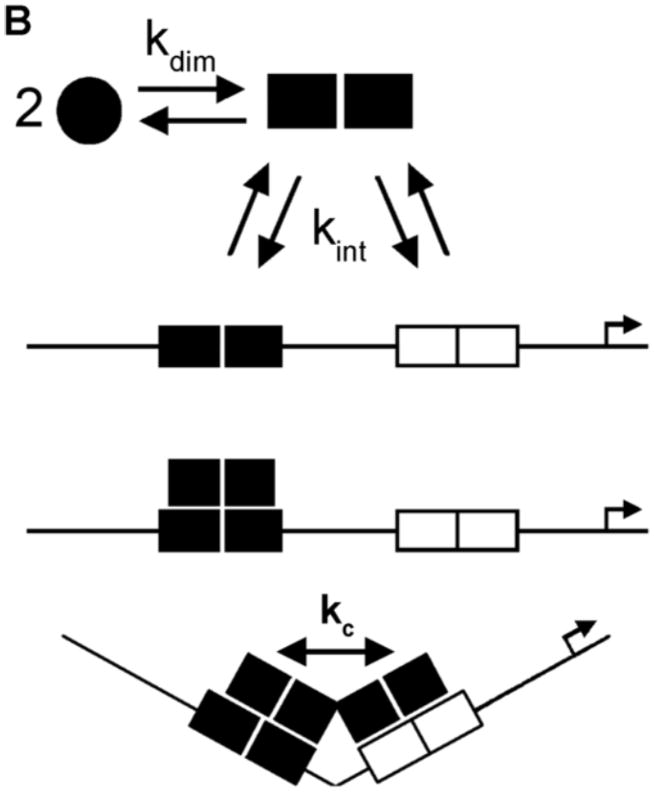
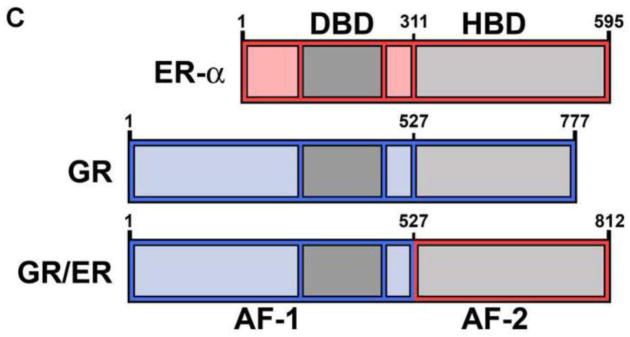
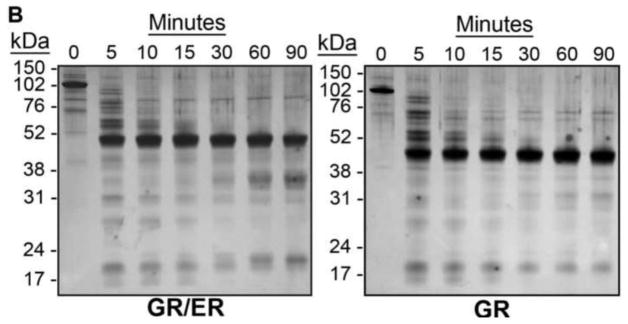
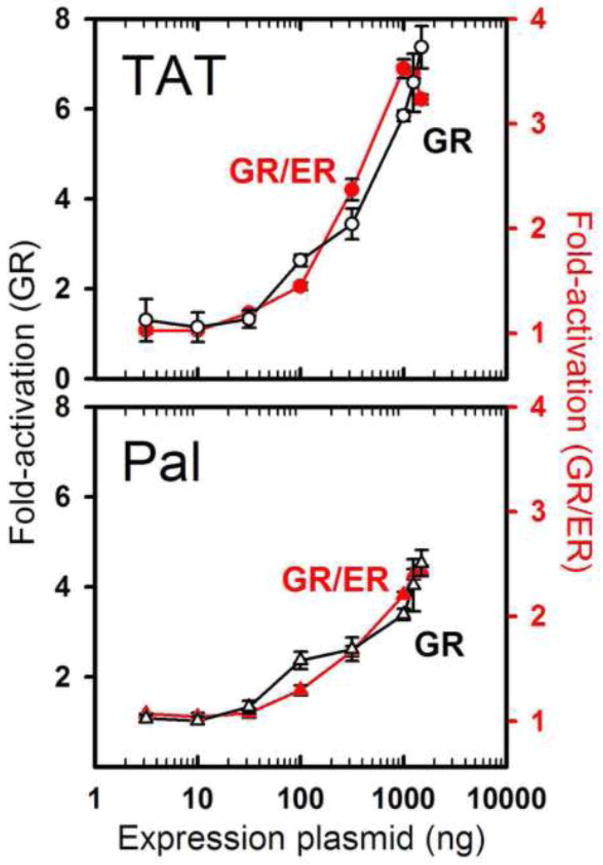
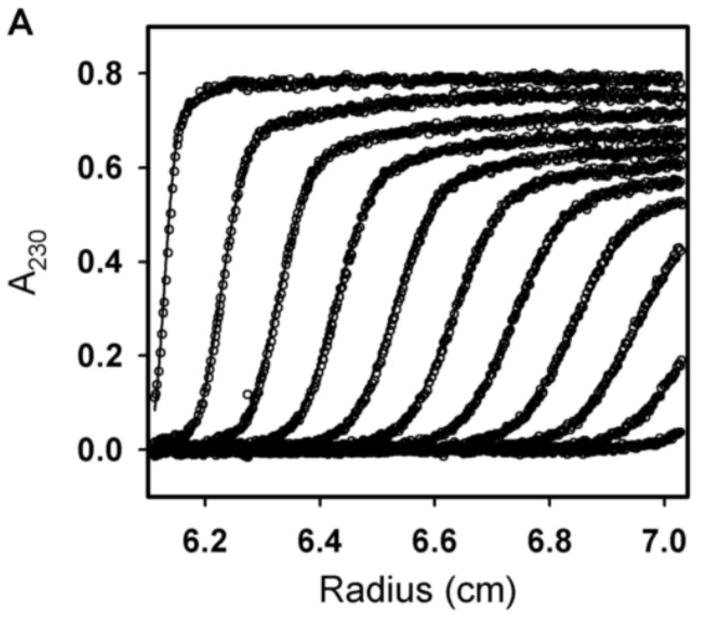
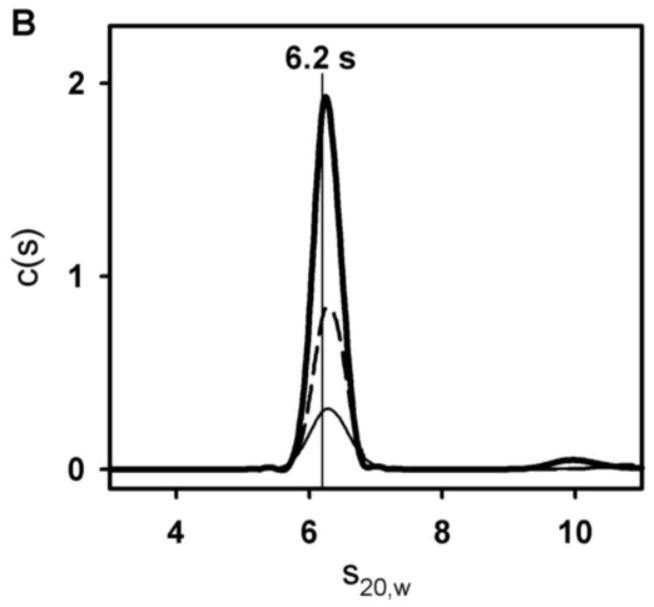
Steroid receptors assemble at DNA response elements as dimers, resulting in coactivator recruitment and transcriptional activation. Our work has focused on dissecting the energetics associated with these events and quantitatively correlating the results with function. A recent finding is that different receptors dimerize with large differences in energetics. For example, estrogen receptor-α (ER-α) dimerizes with a ΔG=-12.0 kcal/mol under conditions in which the glucocorticoid receptor (GR) dimerizes with a ΔG≤-5.1 kcal/mol. To determine the molecular forces responsible for such differences, we created a GR/ER chimera, replacing the hormone-binding domain (HBD) of GR with that of ER-α. Cellular and biophysical analyses demonstrate that the chimera is functionally active. However, GR/ER dimerization energetics are intermediate between the parent proteins and coupled to a strong ionic linkage. Since the ER-α HBD is the primary contributor to dimerization, we suggest that GR residues constrain an ion-regulated HBD assembly reaction.


Figures

Figure 1
Figure 1. Schematic representation of human steroid receptors, receptor-promoter binding, and chimeric GR/ER receptor
(A) Generic primary structure schematic. Functional domains are as indicated: DBD, DNA binding domain; HBD, hormone binding domain. An activation function is located within both the N-terminal region and the HBD (AF-1 and AF-2, respectively) (B) HRE2 promoter assembly model. Macromolecular species and interactions are as indicated: circles, hormone-bound receptor monomers; squares, receptor dimers. Dimerization (kdim) is coupled to response element binding (kint); complete occupancy is coupled to an inter-site cooperative interaction (kc). Arrow refers to the direction of transcriptional start site. (C) Chimeric GR/ER; N-terminal region and DBD of GR is fused to the HBD of ER-α. Amino acid number is indicated above each receptor. Functional regions are as indicated for Panel A.
Figure 2
Figure 2. GR/ER purification and analysis by proteolysis
(A) Coomassie-stained SDS-PAGE image of 5 μg purified GR/ER. (B) Silver-stained SDS-PAGE of chymotryptic digestions of 1.0 μM GR/ER and GR as a function of time. Purification and biophysical characterization of full-length human GR was described previously [8].
Figure 3
Figure 3. GR/ER and GR maintain identical sequence-specific differences in transcriptional activity
Ligand-dependent increase in GR/ER and GR transcriptional activity is plotted as a function of respective expression plasmid. E2-induced GR/ER (red, right axis) and TA-induced GR (black, left axis) dose-response curves measured for the TAT (upper) and Pal (lower) response element sequences. GR/ER curves were overlaid with GR curves using a common y-axis scaling factor. Data were collected in COS7 cells using a pA3 promoter-reporter construct. Cellular expression levels of GR/ER and GR were linear with respect to amount of expression plasmid; see Figure S1.
Figure 4
Figure 4. Sedimentation velocity analysis of GR/ER at 100 mM NaCl, pH 8.0 and 4°C
(A) Sedimentation velocity data and fit of 2 μM GR/ER at 100 mM NaCl, pH 8.0 and 4°C. Only every fourth scan is shown for clarity. (B) Sedfit [18] c(s) analysis of 2 (thick solid line), 1 (dashed line) and 0.5 (thin solid line) μM GR/ER sedimentation velocity data. As indicated by vertical line, position of major peak is 6.2 s.
Figure 5
Figure 5. Sedimentation equilibrium analysis of GR/ER at 100 mM NaCl, pH 8.0 and 4°C
(A) Sedimentation equilibrium of 2, 1 and 0.5 μM GR/ER collected at 14,000 (triangles), 17,000 (squares) and 21,000 (circles) rpm. Lines represent global analysis of data using a single-species model as implemented in the program NONLIN [21]. (B) Residuals of fit to single-species model, only every other residual is shown for clarity. Symbols are as indicated for Panel A.
Figure 6
Figure 6. Sedimentation velocity analysis of GR/ER at 500 mM NaCl, pH 8.0 and 4°C
c(s) distributions determined by Sedfit [18] for 2 (solid thick line), 1 (dashed line) and 0.5 (solid thin line) μM GR/ER. As indicated by vertical lines, major peak positions are 4.4 and 6.2 s.
Figure 7
Figure 7. Sedimentation equilibrium analysis of GR/ER at 500 mM NaCl, pH 8.0 and 4°C
(A) Sedimentation equilibrium of 2, 1 and 0.5 μM GR/ER collected at 14,000 (triangles), 17,000 (squares) and 21,000 (circles) rpm. Lines represent global analysis of all data using a monomer-dimer self-association model as implemented in the program NONLIN [21]. (B) Residuals of fit to monomer-dimer model, only every other residual is shown for clarity. Symbols are as indicated for Panel A.
Figure 8
Figure 8. Linkage analysis of GR/ER dimerization energetics and NaCl concentration
Shown are the resolved dimerization constants plotted as ln(kdim). Values were determined at pH 8.0 and 4°C, in a buffer containing 100, 150, 200, 300, 500, or 750 mM NaCl. Open square, 100 mM NaCl as estimated by quantitative footprinting. Filled circles, 150 to 750 mM NaCl as determined by sedimentation equilibrium. Line represents linear regression of filled circles only. Error bars represent 68% confidence intervals as determined by the program NONLIN [21].
Figure 9
Figure 9. Quantitative analysis of GR/ER HRE2 assembly
(A) DNA sequence and response element position within the HRE2 promoter. (B) Representative quantitative footprint titration of the HRE2 promoter determined at pH 8.0, 100 mM NaCl and 4°C. Schematic to the right indicates the location of the HRE binding sites; arrow refers to direction and approximate location of the transcriptional start site. (C) Shown in red is GR/ER binding to site 1 (closed squares) and 2 (open squares) of the HRE2 promoter from two independent footprint titrations. Shown in blue is GR/ER binding to site 2 (open circles) of the reduced valency HRE1- promoter from two independent footprint titrations. Lines represent a simultaneous best fit analysis of the HRE2 (red) and HRE1- (blue) data sets using the dimer binding model (Eqs. 6 and 7 and Figure 1B). GR/ER binds to sites 1 and 2 on the HRE2 with equal affinity; therefore a single (red) line describes binding to both sites.
Figure 10
Figure 10. Distribution of microstate energetics for steroid receptor dimer assembly at the HRE2 promoter
Measured dimer intrinsic (kint – closed squares), dimerization (kdim – open circles) and cooperative (kc – closed triangles) energetics. Linear regression of each parameter is shown to emphasize each trend across receptor family members. The values for ER-α, PR-A, PR-B and GR have been previously reported [5, 7, 8]; values for GR/ER are taken from Table 3 (global fit including kdim as a fitted parameter). Since there is no evidence for GR dimerization, kdim (100 μM) is plotted as a lower limit; this is represented by the downward arrow. Because GR intrinsic affinity (kint) was resolved using the assumed dimerization affinity of 100 μM, it is also presented as a limit via an upward arrow [8].

References

    1. Tsai MJ, O’Malley BW. Molecular mechanisms of action of steroid/thyroid receptor superfamily members. Annu Rev Biochem. 1994;63:451–486. - PubMed
    1. Monroe DG, Getz BJ, Johnsen SA, Riggs BL, Khosla S, Spelsberg TC. Estrogen receptor isoform-specific regulation of endogenous gene expression in human osteoblastic cell lines expressing either ERα or ERβ. J Cell Biochem. 2003;90:315–326. - PubMed
    1. Richer JK, Jacobsen BM, Manning NG, Abel MG, Wolf DM, Horwitz KB. Differential gene regulation by the two progesterone receptor isoforms in human breast cancer cells. J Biol Chem. 2002;277:5209–5218. - PubMed
    1. Wan Y, Nordeen SK. Overlapping but distinct gene regulation profiles by glucocorticoids and progestins in human breast cancer cells. Mol Endocrinol. 2002;16:1204–1214. - PubMed
    1. Connaghan-Jones KD, Heneghan AF, Miura MT, Bain DL. Thermodynamic analysis of progesterone receptor-promoter interactions reveals a molecular model for isoform-specific function. Proc Natl Acad Sci U S A. 2007;104:2187–2192. - PMC - PubMed

Publication types

MeSH terms

LinkOut - more resources